International Prognostic Index (IPI) for Aggressive Lymphoma
A comprehensive guide to the IPI score, its clinical validation in Western and Asian cohorts, and its role in risk-stratifying aggressive non-Hodgkin lymphoma.
Quick Navigation
- 1. Introduction to IPI for Aggressive Lymphoma
- 2. Defining the International Prognostic Index (IPI)
- 3. Clinical Significance of the IPI Score in Hematology Practice
- 4. Evidence and Validation Across Global Populations
- 5. Evolution and Variants of the Original IPI
- 6. Platform Implementation and Workflow
- 7. Impact on Clinical Care, Education, and Research
- 8. Clinical FAQ: International Prognostic Index (IPI)
1. Introduction to IPI for Aggressive Lymphoma
The original International Prognostic Index (IPI) provides baseline prognostic stratification for aggressive non‑Hodgkin lymphoma. The OncoToolkit calculator translates this classic five‑factor score into a transparent point‑of‑care tool; it does not prescribe treatment intensity.4
By capturing age, Ann Arbor stage, LDH relative to the institutional upper limit of normal, ECOG performance status, and extranodal involvement, the IPI stratifies patients into four risk groups. The displayed 5‑year overall survival values are historical observations from the original pre‑rituximab cohort, not contemporary R‑CHOP outcomes or individualized prognoses.4
2. Defining the International Prognostic Index (IPI)
The IPI was developed as a prognostic model for aggressive non‑Hodgkin lymphoma rather than as a DLBCL‑only treatment rule. The original project analyzed more than 2,000 patients treated with doxorubicin‑containing regimens and identified five adverse baseline factors.4
The original IPI assigns one point for each of the following adverse baseline factors:
- • Age > 60 years
- • Ann Arbor stage III or IV
- • Elevated serum LDH above the upper limit of normal
- • ECOG/Zubrod performance status ≥ 2
- • More than one extranodal site of disease
Total points (0–5) categorize patients into low (0–1), low‑intermediate (2), high‑intermediate (3), or high risk (4–5) groups. Historical pre‑rituximab 5‑year overall survival in the original cohort was 73%, 51%, 43%, and 26%, respectively. These group observations should not be substituted for contemporary regimen outcomes or individualized prognosis.4
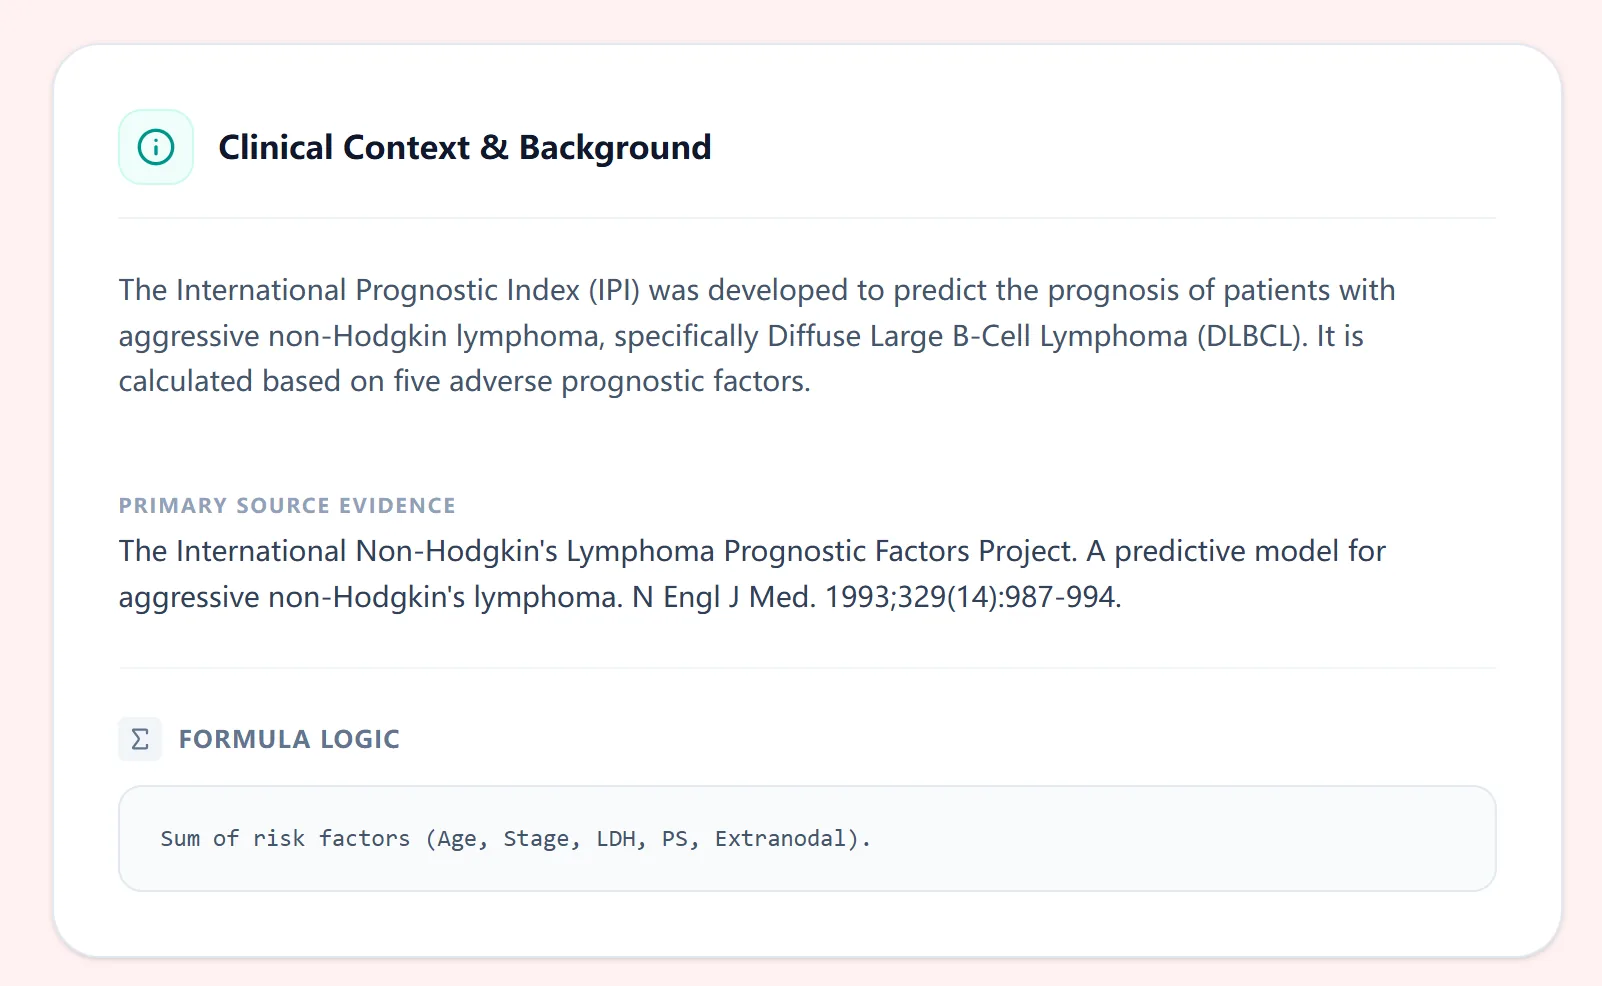
Figure 1. The background section on our platform summarizes the purpose of the IPI, the disease setting (aggressive NHL/DLBCL), and primary validation source, helping clinicians quickly recall how and why this tool was developed.
3. Clinical Significance of the IPI Score in Hematology Practice
IPI risk groups provide a standardized baseline prognostic description and a stratification variable for research. They do not, by themselves, establish a need for intensified therapy, consolidation, transplant, cellular therapy, or any specific frontline regimen.4
For example, a patient older than 60 years with stage IV disease, LDH above the institutional upper limit of normal, ECOG 2, and multiple extranodal sites has all five adverse factors and an original IPI score of 5. The result supports a shared prognostic vocabulary for documentation and trial stratification but does not determine surveillance or treatment.4
Without digital support, calculating the IPI requires tracking five variables and mapping the additive total to a risk group. OncoToolkit displays the score, risk group, factor-by-factor trace, and the explicitly labeled historical pre‑rituximab 5‑year overall survival observation from the original cohort.4
4. Evidence and Validation Across Global Populations
4.1 The Statistical Logic of the IPI
The IPI was derived using multivariable analysis of overall survival, which identified five independent clinical predictors. Each variable was dichotomized and assigned one point when adverse, yielding a simple additive score from 0 to 5.4
On our platform, this logic is implemented deterministically: each “Yes” response to an adverse factor adds one point, and the calculator displays the total score together with the corresponding risk group and survival estimate. This transparent design helps clinicians understand exactly how the result is generated and makes the tool easy to explain to trainees and trial coordinators.
4.2 Validation in Western Patient Cohorts
In Western series from North America and Europe, the original IPI showed clear separation of survival curves: in large rituximab‑treated cohorts, 5‑year overall survival has been reported at roughly 80–85% for low‑risk patients versus roughly 45–55% for high‑risk patients, with intermediate groups in between. Studies comparing IPI, R‑IPI, and NCCN‑IPI in Western DLBCL populations found that although all three scores retained prognostic value, the NCCN‑IPI provided superior discrimination between low‑ and high‑risk groups, particularly in the rituximab era.6, 8, 2, 3, 1
The NCCN‑IPI, introduced in 2014, refines age into four categories, treats LDH in multiple tiers relative to normal, and emphasizes specific high‑risk extranodal sites, leading to five‑year survival estimates ranging from over 90% in the lowest‑risk category to around 40–50% in the highest‑risk group in large Western datasets. These findings underscore that the original IPI remains useful, but newer derivatives can sharpen risk discrimination when needed.2, 6, 1
4.3 Validation in Asian and Diverse Populations
Importantly, the IPI and its derivatives have also been extensively tested in Asian and other non‑Western cohorts. In Chinese, Japanese, and broader Asian DLBCL populations, investigators have confirmed that the original IPI stratifies overall survival, but some variables—such as the impact of extranodal disease—behave slightly differently. For example, validation work in an Asian cohort showed that the NCCN‑IPI provided clearer separation of survival curves than the original IPI, especially at the high‑risk end, echoing results from Western series.9, 10, 3
A study from Saudi Arabia representing the Middle East and North Africa (MENA) region also validated the IPI, with 3‑year overall survival of approximately 84%, 76%, 67%, and 51% for low, low‑intermediate, high‑intermediate, and high‑risk groups, respectively, but again found that R‑IPI and especially NCCN‑IPI offered more divergent curves. Collectively, these data support the use of IPI as a globally applicable baseline model while highlighting that refined indices may be preferable when detailed prognostication is required in diverse populations.3
4.4 IPI in Contemporary Guidelines and Research
Current DLBCL guidelines from major bodies such as the National Comprehensive Cancer Network (NCCN) and the European Society for Medical Oncology (ESMO) continue to recommend IPI‑based risk stratification at diagnosis, with many algorithms specifically referencing IPI or NCCN‑IPI when summarizing expected outcomes and framing clinical trial discussions. These guidelines generally advocate standard R‑CHOP or Pola‑R‑CHP as the default frontline regimen across most IPI categories, reserving more intensive strategies for select high‑risk or double‑hit cases, but they use the IPI to contextualize risk and to inform discussions of prognosis.11, 2
Recent advances increasingly integrate IPI with molecular and imaging‑based risk markers rather than replacing it. For example, the CNS‑IPI extends the IPI by adding kidney/adrenal and CNS‑related variables to identify patients at higher risk of central nervous system relapse, and several immune‑related and genetic subtype‑based IPI models combine the traditional score with gene expression or mutational data to further refine survival predictions. Emerging geriatric prognostic indices for older DLBCL patients often start with IPI or NCCN‑IPI and then layer in frailty, comorbidity, and functional measures to improve risk assessment in this vulnerable group.12, 13, 14, 15
5. Has the original IPI been expanded or modified?
The core five‑factor IPI has not changed: age, stage, LDH, performance status, and extranodal sites remain the foundational variables, and the scoring system still runs from 0 to 5 points. What has evolved is how clinicians choose among several related tools built on this foundation:5, 4
Tailors the original score for younger patients by focusing on stage, LDH, and performance status.2, 4
OncoToolkit’s calculator focuses on the original IPI because it is widely recognized, easy to apply in real time, and remains embedded in major guidelines and clinical trial designs.11, 1
6. How the IPI calculator works on our platform
On our IPI calculator page at oncotoolkit.com/calculator/international-prognostic-index-lymphoma, users interact with a clean, button‑based input form designed for rapid bedside use. Each of the five IPI variables is presented as a simple yes/no choice with embedded score hints so that the associated point value is visible at a glance.
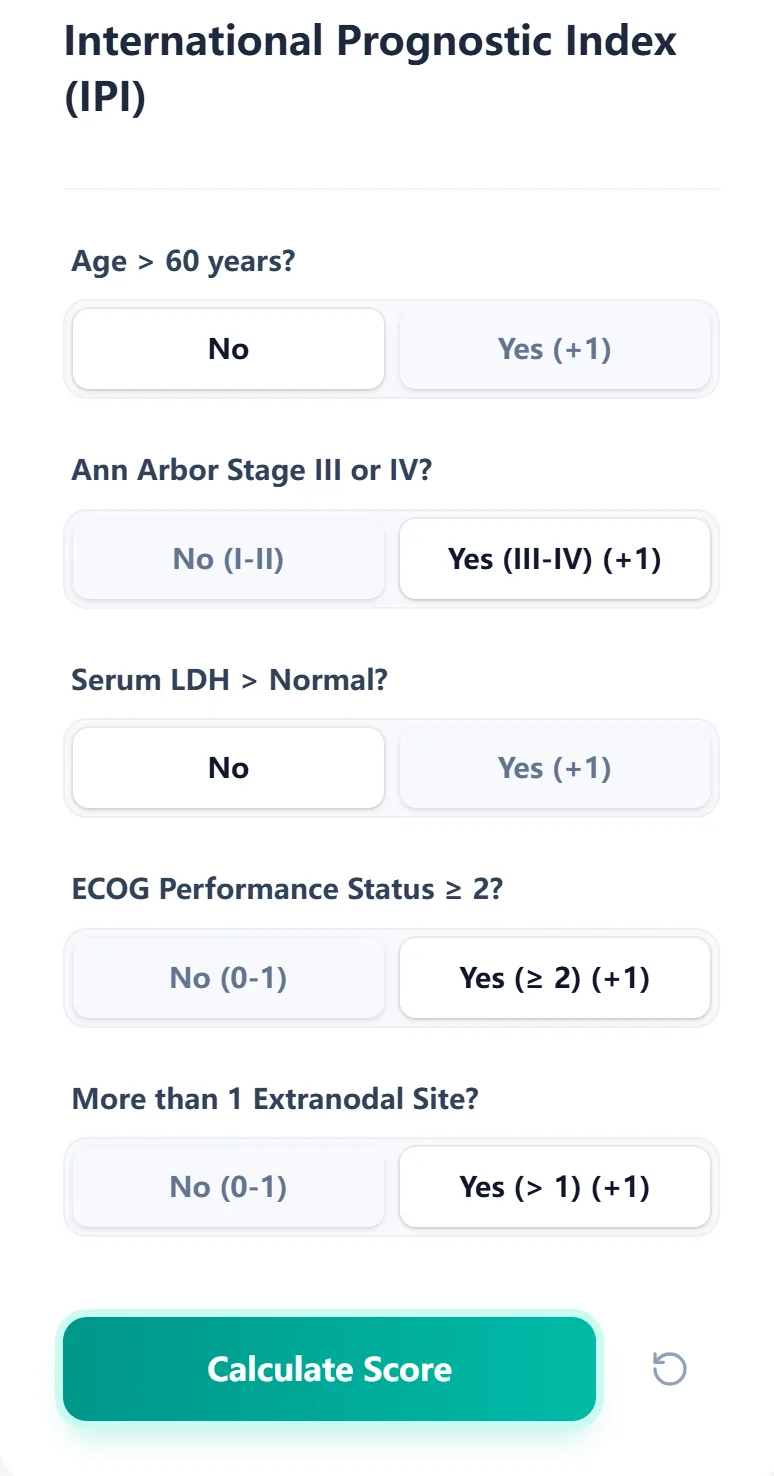
Figure 2. The input form allows hematologists to quickly select IPI risk factors—age, stage, LDH, ECOG performance status, and extranodal sites—with a clear indication of how each “Yes” contributes to the overall score.
The workflow typically looks like this:
- 1 Age – Confirm whether the patient is older than 60 years; a “Yes” adds one point.
- 2 Ann Arbor stage – Select stage III/IV for advanced disease; “Yes” adds one point.
- 3 Serum LDH – Indicate whether LDH exceeds your laboratory’s upper limit of normal.
- 4 Performance status – Record whether ECOG performance status is ≥ 2.
- 5 Extranodal involvement – Indicate if more than one extranodal site is involved.
Once all five fields are completed, clicking “Calculate Score” displays the total, mapped risk group, additive factor trace, and historical pre‑rituximab 5‑year overall survival observation from the original cohort. Missing or malformed input returns a neutral Invalid Input result rather than a favorable score.4
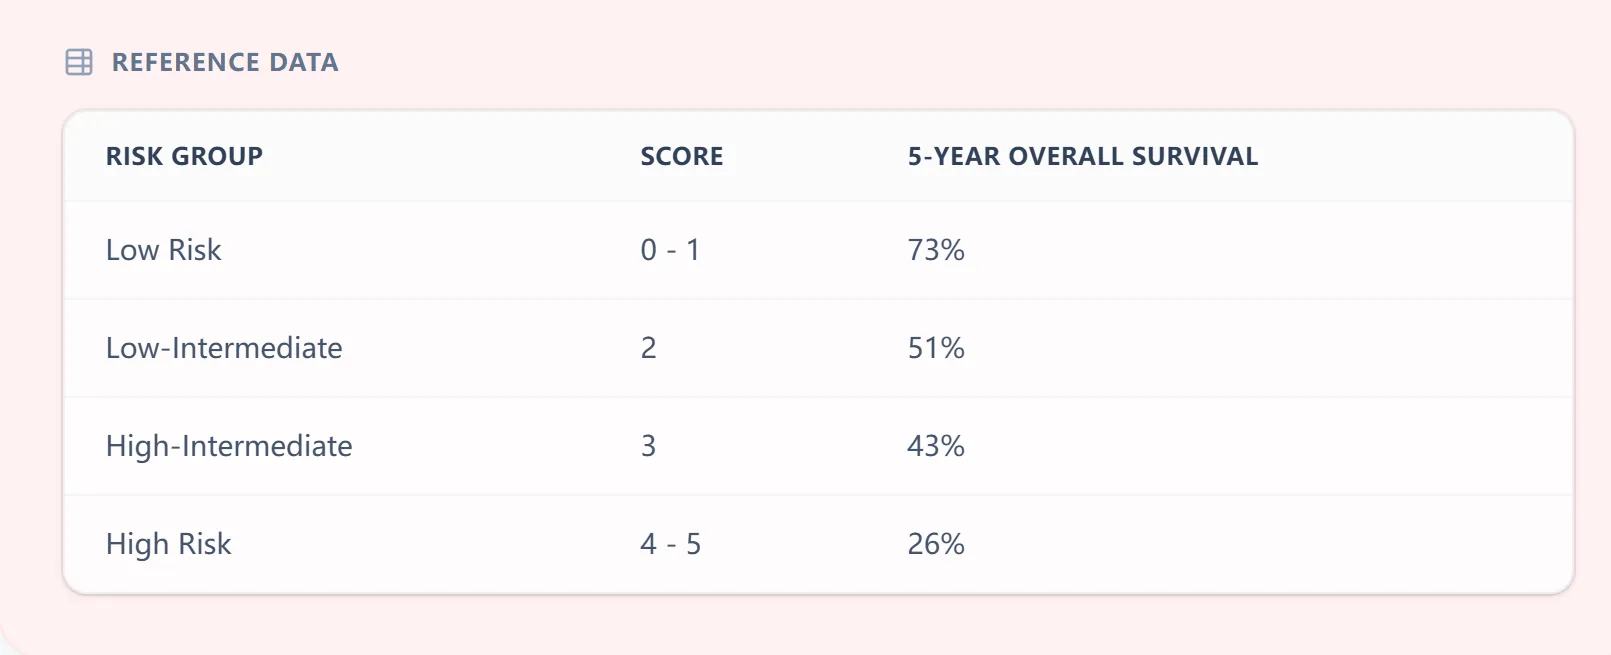
Figure 3. The reference table links IPI scores (0–5) to risk groups and historical pre‑rituximab 5‑year overall survival observations from the original cohort.
The platform also supports optional patient identifiers or case labels for local documentation, which is particularly helpful when reviewing several cases at once during a weekly lymphoma meeting.
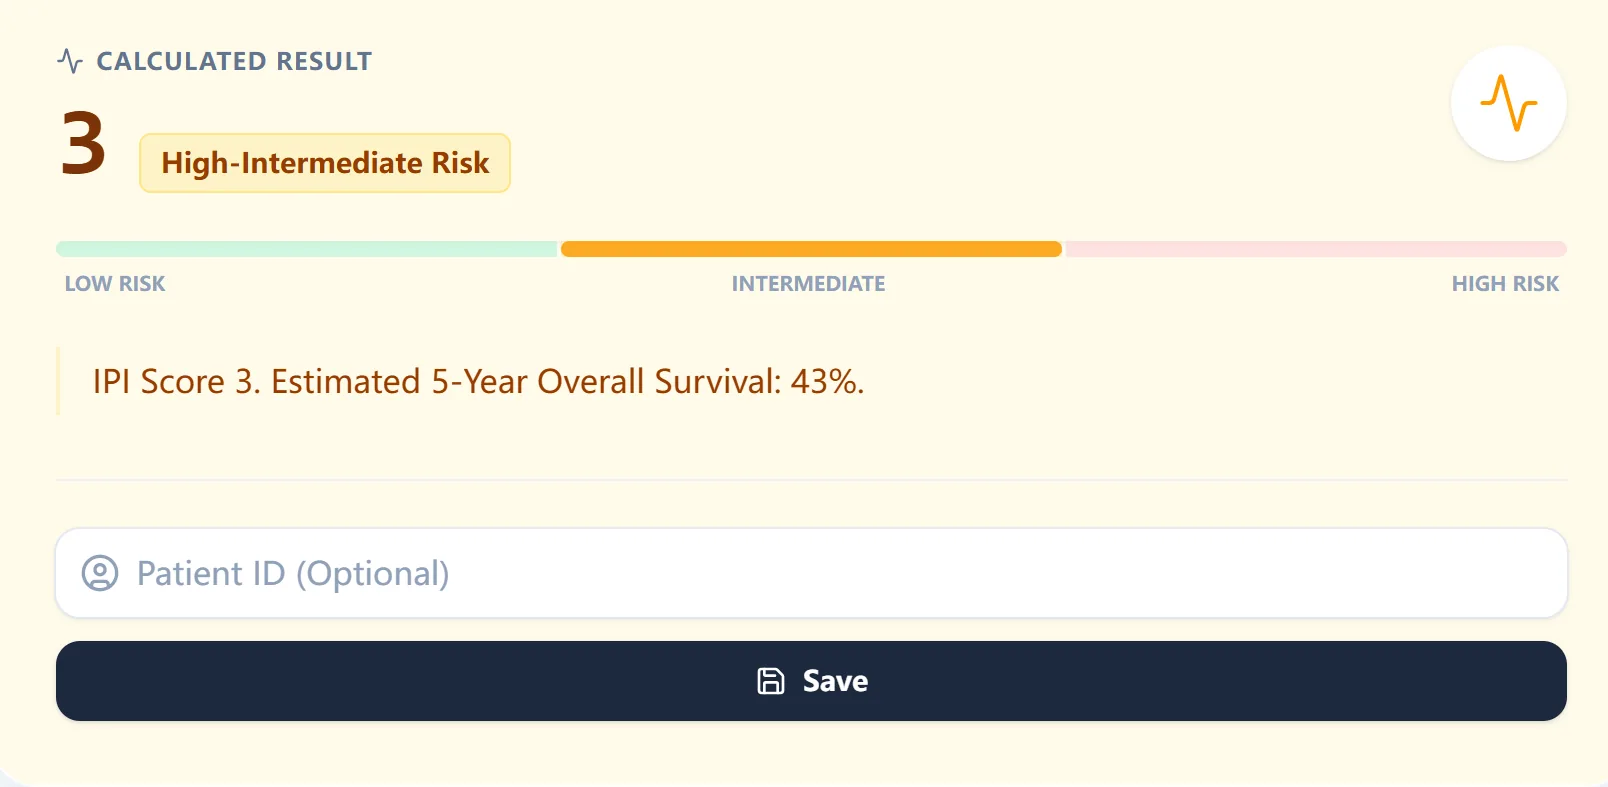
Figure 4. An IPI score of 3 maps to high‑intermediate risk and the original cohort’s historical pre‑rituximab 5‑year overall survival observation of 43%.
7. How OncoToolkit supports clinical care, education, and research
7.1 Routine clinical decision support
In day‑to‑day hematology practice, the IPI calculator can standardize baseline risk documentation at diagnosis, during second opinions, and when preparing cases for MDT review. Treatment decisions require disease subtype, pathology and molecular features, patient factors, contemporary evidence, and clinical judgment beyond the original IPI.4
7.2 Education and simulation for trainees
For fellows and residents, the IPI is often their first exposure to structured prognostic scoring in lymphoma. On our platform, the clear mapping from inputs to score and survival estimates makes it easy to walk through case‑based teaching, highlight how changes in ECOG status or LDH alter prognosis, and compare the original IPI with R‑IPI, NCCN‑IPI, or CNS‑IPI.12, 8, 6, 4, 2
7.3 Clinical research and quality improvement
Because the IPI is used as a stratification variable in trials and registry studies, a standardized implementation supports reproducible data capture and retrospective analysis. It should not be used alone to audit treatment appropriateness or eligibility for advanced therapies.4
7.4 Opportunities for internal linking
From this IPI article, natural anchor text for internal links to related calculators might include:
- “DLBCL risk stratification tools” – linking to a page aggregating lymphoma prognostic calculators.
- “NCCN‑IPI and R‑IPI calculators” – directing users to more granular rituximab‑era tools.
- “Hematologic oncology risk assessment” – pointing toward disease‑specific prognostic and toxicity calculators.
8. Clinical FAQ: International Prognostic Index (IPI)
When should you not rely solely on the IPI for lymphoma prognosis?
The IPI should not be used in isolation when molecular high‑risk features (such as double‑hit lymphoma, double‑expressor status, or TP53 alterations) are present, as these factors can significantly modify risk within the same IPI category. It is also less reliable in heavily pretreated or relapsed/refractory settings, where prior therapy and evolving disease biology shape outcomes beyond baseline clinical variables; in those scenarios, disease‑specific tools and expert MDT input should complement IPI‑based estimates.16, 7, 2
How does the IPI differ from the Revised IPI (R‑IPI) and NCCN‑IPI?
The Revised IPI simplifies risk groups into three strata (very good, good, poor) for rituximab‑treated DLBCL while retaining the same five variables, making it appealing for broad survival comparisons. The NCCN‑IPI refines age and LDH into several categories and gives extra weight to specific extranodal sites, achieving stronger discrimination of 5‑year overall survival (about 92% vs 49% in low‑ vs high‑risk groups in pooled analyses) than the original IPI or R‑IPI.8, 6, 1, 2
Can the IPI be used in patients with significant comorbidities or poor performance status from non‑lymphoma causes?
Yes, the IPI can still be calculated, but interpretation requires caution when performance status is driven by comorbidities or frailty rather than lymphoma, as this may exaggerate the lymphoma‑specific risk signal. In such cases, clinicians should integrate geriatric assessment, comorbidity indices, and patient goals of care alongside the IPI.15, 7
Is the IPI validated in both Western and Asian populations?
Yes. The IPI was originally developed from predominantly Western trial cohorts but has since been validated in multiple Asian, MENA, and other non‑Western populations, where it continues to stratify overall survival meaningfully.9, 10, 3, 1
What is the most common practical mistake when calculating the IPI?
Common pitfalls include misclassifying ECOG performance status, overlooking subtle extranodal sites such as marrow or liver involvement, and using outdated LDH reference ranges rather than the current institutional upper limit of normal.17, 7
Ready to Simplify Your Lymphoma Risk Assessment?
Access the International Prognostic Index (IPI) calculator for rapid, evidence-aligned results at the point of care.
Calculate IPI Score Now
Free to use. No registration required.
References
- Zhou Z, et al. Update on the International Prognostic Index in the era of rituximab. Source
- Recent clinical guidelines on DLBCL management. Source
- Validation of IPI in diverse populations and MENA region. Source
- International Non‑Hodgkin's Lymphoma Prognostic Factors Project. Original IPI development report. N Engl J Med. 1993;329:987‑994. Primary source
- International Prognostic Index Wikipedia Summary. Source
- Zhou Z, et al. An enhanced International Prognostic Index (NCCN-IPI) for patients with diffuse large B-cell lymphoma. Blood. Source
- Clinical decision support impact in hematology. Source
- International prognostic indices in diffuse large B-cell lymphoma. Blood. Source
- Validation of the NCCN-IPI in an Asian cohort. Source
- Comparative study of IPI variants in non-Western populations. Source
- NCCN Guidelines for B-cell Lymphomas. Source
- The CNS-IPI: A risk model to predict CNS relapse. Source
- Genetic and immune markers in lymphoma prognosis. Source
- Molecular subtypes and IPI integration. Source
- Geriatric assessment in DLBCL patients. Source
- Limitations of clinical scores in double-hit lymphoma. Source
- SEER EOD: International Prognostic Index calculation rules. Source