Brock (PanCan) Nodule Risk Calculator: Evidence-Based Lung Nodule Risk Assessment for Oncologists
Use the Brock (PanCan) Nodule Risk calculator to quantify malignancy risk, aligned with BTS, Fleischner, and modern evidence. Get transparent, guideline‑ready results in seconds.
Navigation
Incidental and screening‑detected pulmonary nodules are now routine in lung cancer care, yet only a minority represent malignancy. For lung oncologists, the challenge is to distinguish indolent lesions from aggressive cancers while minimizing unnecessary imaging, biopsies, and patient anxiety.[1], [2], [3], [4]
The Brock (PanCan) Nodule Risk calculator provides a quantified malignancy probability for individual nodules, using a validated multivariable model derived from the Pan‑Canadian Early Detection of Lung Cancer Study. At OncoToolkit, we’ve built a transparent, BTS‑aligned implementation of this score, complete with explicit calculation logic, BTS/Fleischner‑based risk bands, and clear interpretive text, helping you integrate evidence into everyday MDT and clinic workflows without adding to cognitive load.[5], [6]
1. What is the Brock (PanCan) Nodule Risk Score?
The Brock (PanCan) model is a logistic regression–based prediction tool that estimates the probability that a pulmonary nodule detected on CT is malignant. It was developed in screening cohorts and has since been widely adopted in guideline‑based nodule pathways, particularly in the UK and Europe, and is discussed in contemporary international reviews and S3‑level guidance.[2], [3], [6], [7], [8], [1], [5]
1.1 Core Predictors and What the Score Estimates
In its published form, the Brock model incorporates:
Each variable contributes a weighted coefficient, and the model outputs a continuous probability of malignancy (0–100%) for the index nodule, not just a categorical label. This probability can then be mapped to practical management strata (for example, surveillance vs PET‑CT vs biopsy) according to guidelines such as BTS, Fleischner, the German S3 guideline, and international consensus statements.[3], [7], [8], [9], [2], [5]
1.2 Historical Context and Place in Guidelines
McWilliams et al. first reported the PanCan model in 2013, using more than 7000 nodules from the Pan‑Canadian Early Detection of Lung Cancer Study and validating it in an independent British Columbia cohort. The model showed excellent discrimination, with areas under the ROC curve above 0.90 even for nodules 10 mm or smaller.[5], [6]
Brock is now integrated into:
British Thoracic Society (BTS) pulmonary nodule guideline as a recommended tool for initial malignancy estimation and for determining when PET‑CT and Herder modelling should be performed.[7], [10], [11], [1]
Fleischner Society 2017 recommendations, which emphasize structured risk assessment and stratify nodules into very low, low/intermediate, and high‑risk categories with tailored follow‑up.[9], [1]
Recent international overviews and German S3‑level summaries on incidental pulmonary nodules, which discuss Brock alongside other models as one of the best‑validated quantitative tools.[8], [12], [2], [3]
These documents reinforce Brock’s role as a cornerstone tool for CT‑detected nodules in high‑risk adults, particularly when combined with volume measurements and PET‑CT in a stepwise pathway.[1], [2], [3], [7]
2. Why Brock Nodule Risk Matters in Lung Oncology Practice
2.1 Linking Risk Probability to Real Decisions
For lung oncologists and MDTs, the Brock probability is not an abstract number—it directly informs decisions such as:
- Whether a small screen‑detected nodule can safely undergo CT surveillance alone.[4], [9], [1]
- When a nodule should trigger PET‑CT and subsequent Herder risk recalculation.[11], [3], [7], [1]
- When to move towards image‑guided biopsy, surgical resection, or non‑surgical ablative therapy once risk crosses key thresholds.[10], [13], [1]
BTS guidance typically aligns management with the following bands, which we mirror in our calculator’s reference table:
2.2 Reducing Cognitive Load and “Calculator Fatigue”
Manually applying the Brock model at scale is tedious: one must locate the original coefficients, plug values into the logistic formula, and then interpret the probability within guideline tables. In fast‑paced lung cancer clinics and radiology reporting sessions, this overhead contributes to “calculator fatigue”, encouraging clinicians to rely on gestalt alone.[12], [14], [15], [6], [7], [5]
OncoToolkit addresses this by:
- Presenting a single, organized input interface tailored to the Brock model.
- Delivering the risk percentage and category instantly, with embedded BTS/Fleischner‑style management cues.
- Surfacing the step‑by‑step calculation logic, so you see exactly how the final probability was derived.
3. Clinical Evidence and the Math Behind the Brock Model
3.1 Logistic Regression Structure and Coefficients
The Brock model uses logistic regression:
logit(p) = beta_0 + beta_1(age) + beta_2(sex) + beta_3(family history) + ... + beta_n(spiculation)
and
p = e^(logit(p)) / (1 + e^(logit(p)))
where $p$ is the estimated malignancy probability. In the McWilliams publication, older age, female sex, family history of lung cancer, emphysema, larger nodule size, upper‑lobe location, part‑solid morphology, fewer nodules, and spiculation each increased the log‑odds of malignancy.[6], [5]
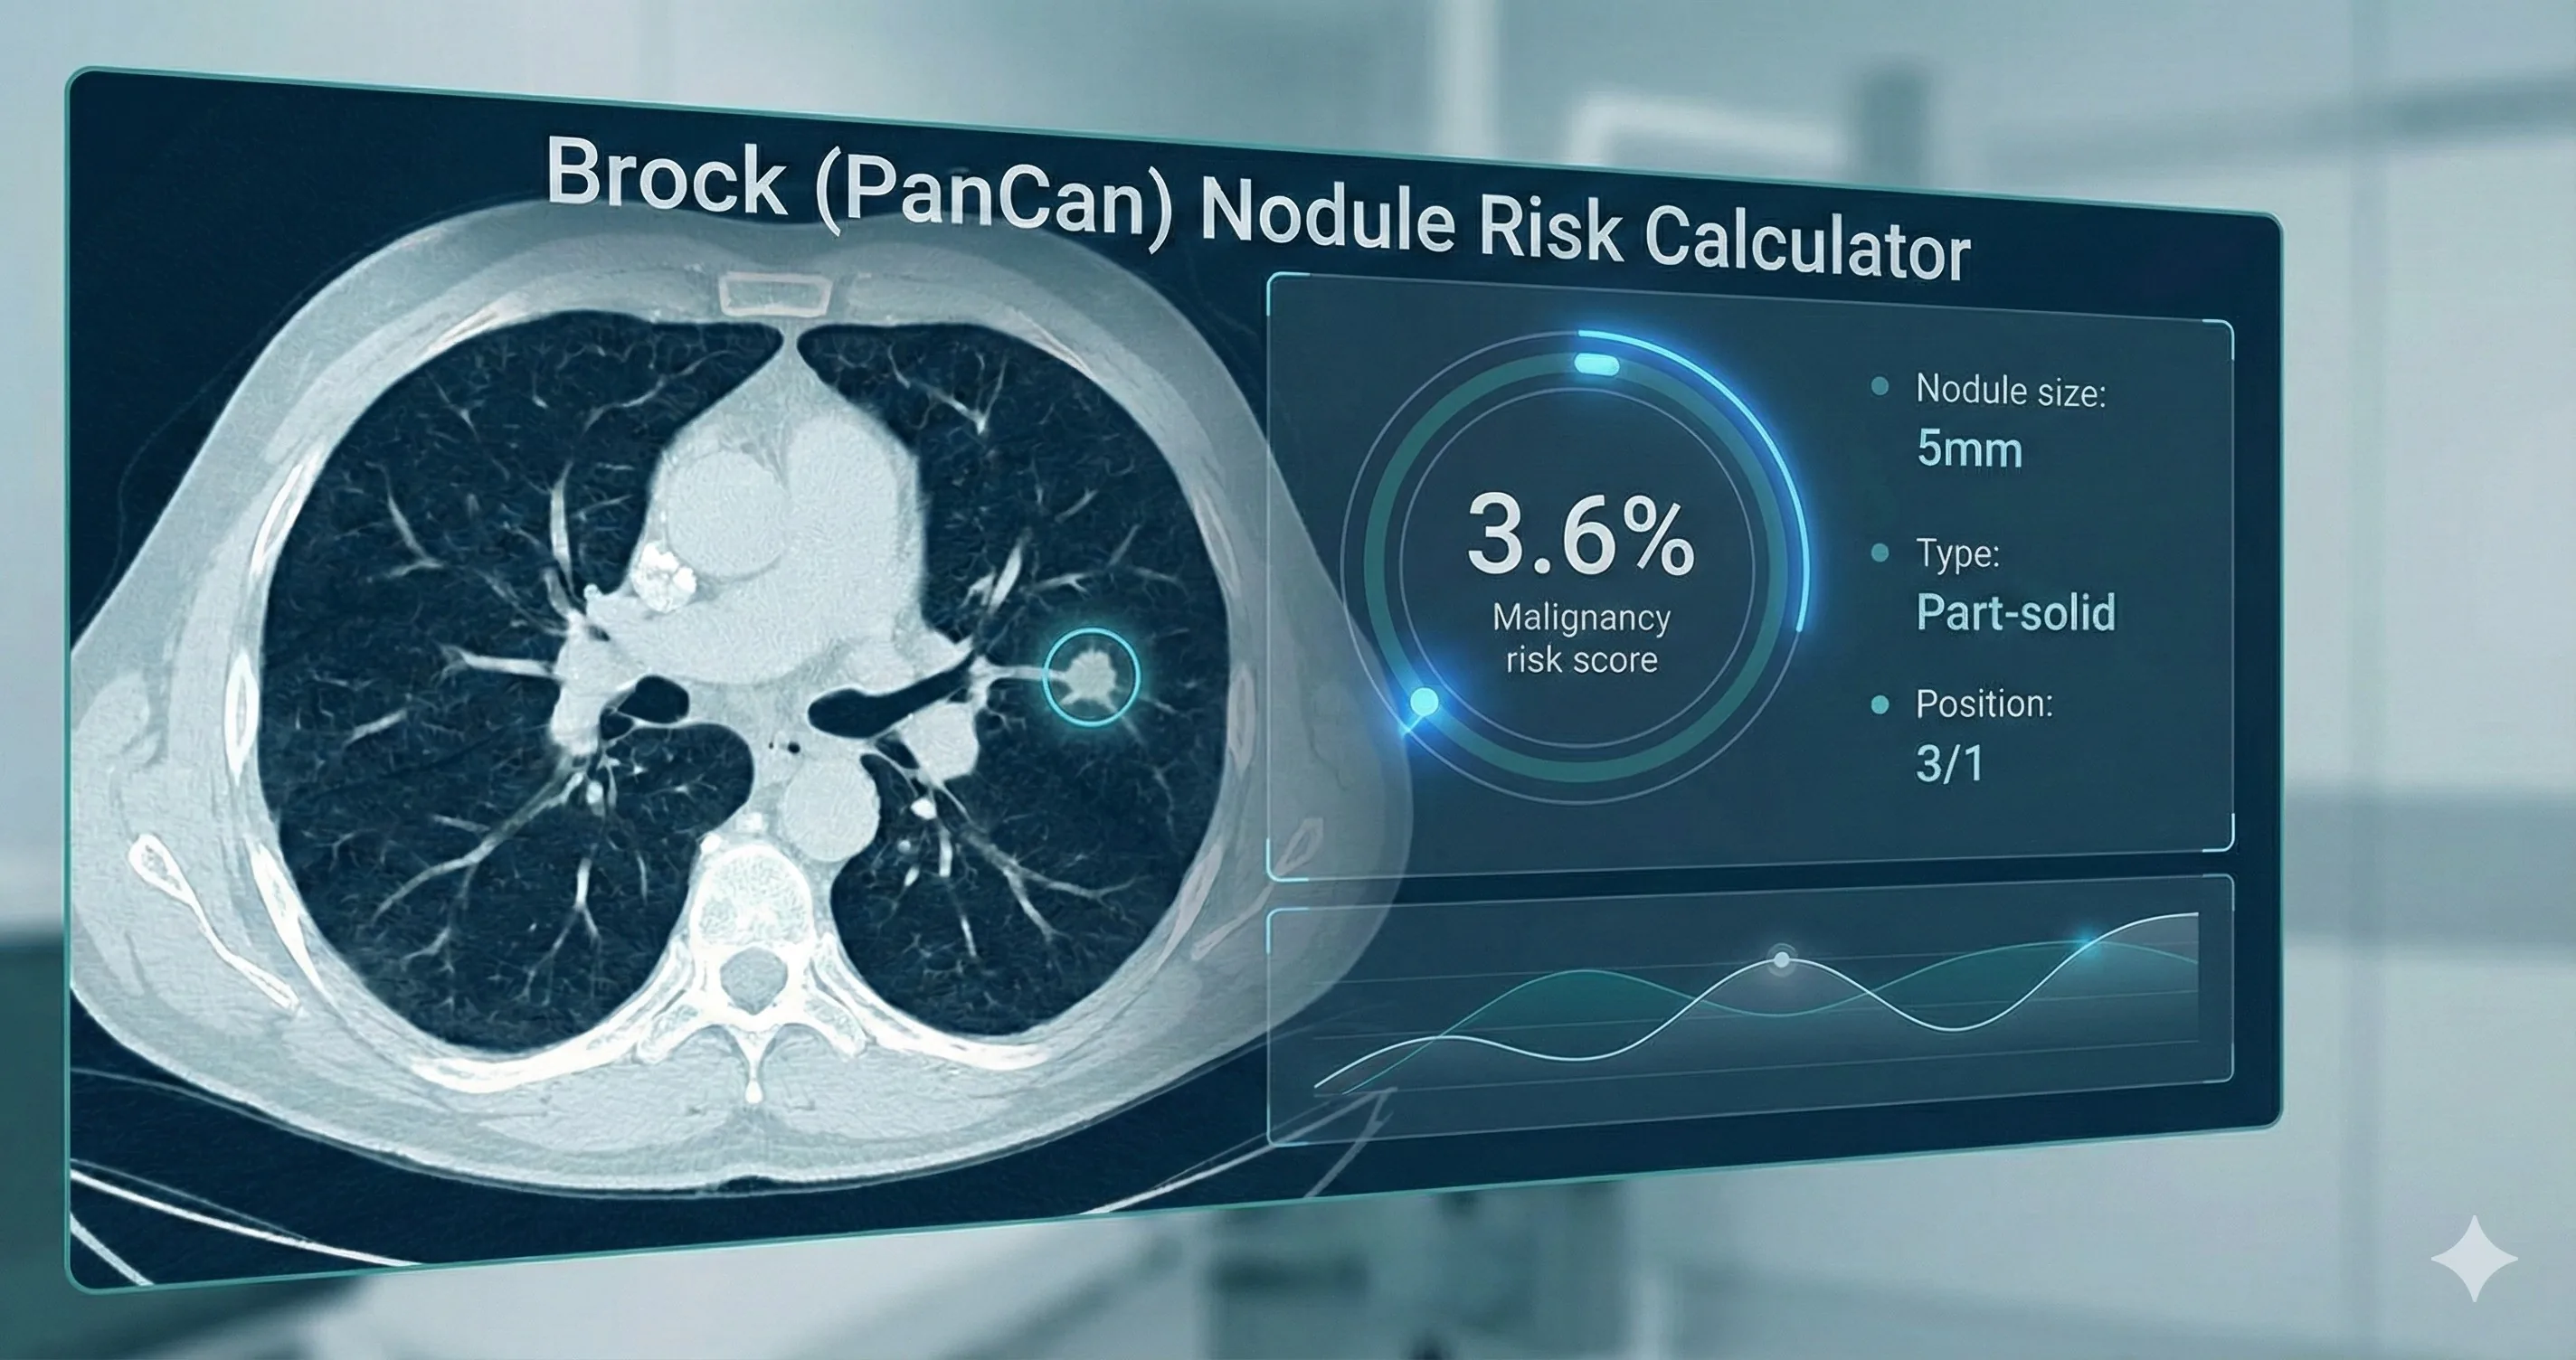
On our platform we expose this logic transparently. In the result example, you can see each coefficient contribution—e.g., age 62 (+1.77), emphysema (+0.30), part‑solid type (+0.84), size 5 mm (+0.60)—summed to a logit, then transformed into a 3.6% probability using the logistic function:
Step 1: Logit = −6.7888 + 0.0285 × 62 + 0.2953 × 1 + 0.8385 × 1 + 0.12 × 5 = −3.288
Step 2: Probability = e^(−3.29) / (1 + e^(−3.29)) = 3.6%
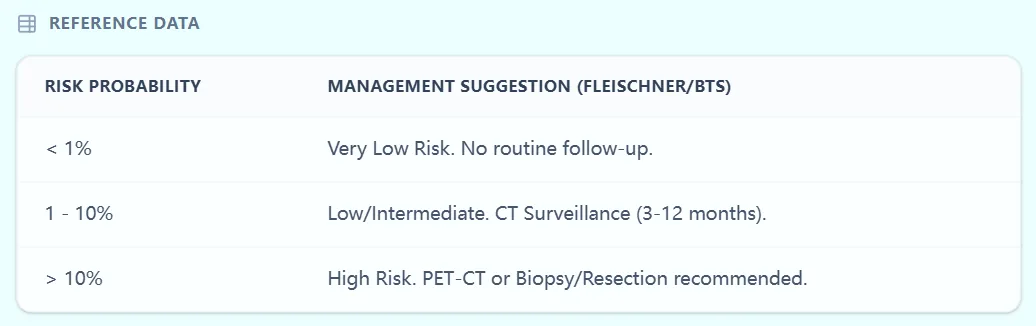
Figure 1. The result screen shows the overall malignancy probability, mapped risk stratum, narrative guidance, and calculation breakdown.
3.2 Development, Validation, and Performance
Development and internal validation
- Cohort: 1871 participants in the Pan‑Canadian Early Detection of Lung Cancer Study with 7008 nodules (102 malignant).[5]
- External validation: 1090 participants in British Columbia chemoprevention trials with 5021 nodules (42 malignant).[5]
- Cancer prevalence: 5.5% (PanCan) and 3.7% (BCCA).[5]
- Performance: AUC >0.90 overall and for nodules ≤10 mm.[5]
External validation and recalibration (NLST and beyond) An important external validation used data from the National Lung Screening Trial (NLST), where the Brock model was applied and then recalibrated to better match the US screening population. Investigators found that discrimination remained strong (c‑statistics around 0.90), but calibration improved after adjusting intercept and slope, highlighting that local recalibration may enhance accuracy without changing the core predictors.[16], [17]
A recent meta‑analysis of the Brock model pooling over 50,000–80,000 nodules across multiple studies confirmed high pooled discrimination (c‑statistics typically 0.84–0.92) and reasonable calibration, although performance varied between screening and incidental cohorts and across regions. These findings underpin guideline recommendations that endorse Brock while encouraging local audit and recalibration where possible.[18], [19], [20], [12], [2], [3]
Guideline integration and comparative studies BTS guidelines identify Brock as one of the preferred tools for initial malignancy estimation, setting a 10% Brock risk threshold for recommending PET‑CT and Herder reassessment. International guideline summaries and S3 discussions echo this staged approach, using Brock as the first quantitative gatekeeper before adding functional imaging and more complex models.[7], [8], [10], [11], [2], [3], [1]
Studies comparing PanCan/Brock with Lung‑RADS and other categorical systems suggest that quantitative models may offer finer discrimination and better calibration, especially for intermediate‑risk nodules. In some analyses, Brock served as the reference standard against which newer machine‑learning tools or AI models were benchmarked.[21], [22], [23], [24], [25], [1]
3.3 Limitations and Thoughtful Use
Important caveats include:
- Population focus: Performance may differ in low‑risk or non‑screening populations.[3], [1], [5]
- Imaging quality and reporting: Accurate classification of nodule type, size, and spiculation is essential.[12], [2], [1]
- Competing pathology: Prevalent granulomatous disease or prior malignancy can affect calibration.[2], [1], [3]
OncoToolkit explicitly reminds users that the calculator is a clinical decision‑support tool, not a standalone directive, and encourages MDT interpretation within the context of guidelines, patient comorbidity, and local prevalence.
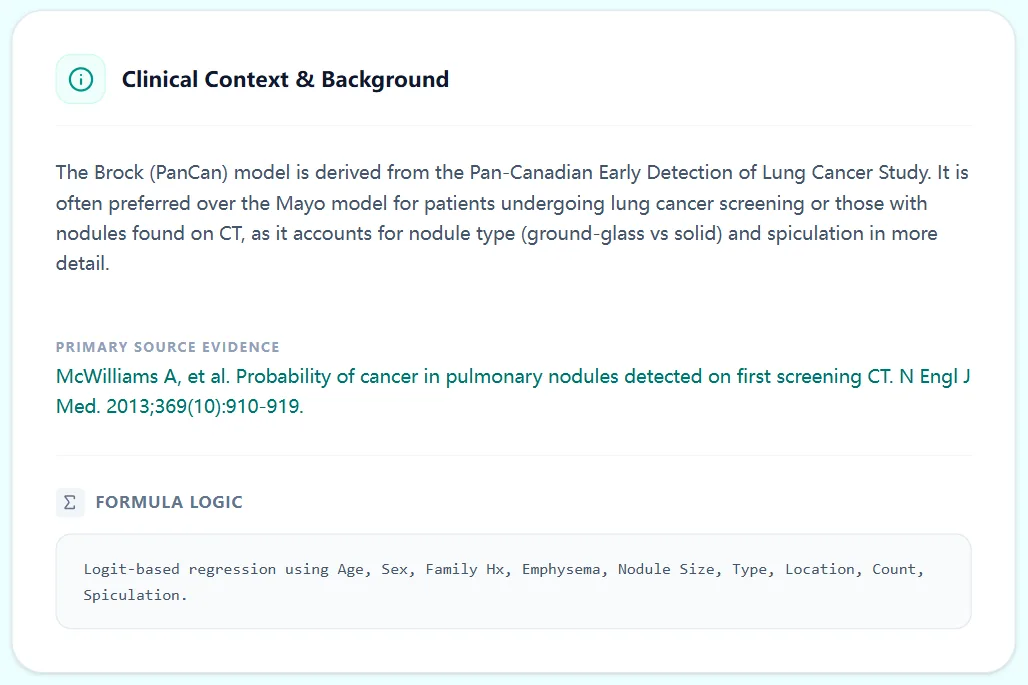
Figure 2. Clinical background panel contrasting Brock with older models (e.g., Mayo).
4. Specific Clinical Use Cases for the Brock (PanCan) Calculator
4.1 Low‑Dose CT Screening Programs
In lung cancer screening programs, a large proportion of participants have small nodules detected on baseline or follow‑up LDCT. Here, Brock can:[22], [1], [5]
- Help determine which nodules require short‑interval follow‑up or volumetric assessment.[1], [3]
- Identify nodules with <1% risk where no additional follow-up is needed.[9], [7], [2]
- Standardize decision‑making across radiologists and sites.[12], [3], [1]
International reviews emphasize that combining Brock‑style models with volume‑doubling time and categorical systems such as Lung‑RADS can optimize screening efficiency.[21], [22], [1]
4.2 Incidentally Detected Nodules on Staging or Diagnostic CT
In patients undergoing CT for non‑screening indications—such as staging of extrathoracic malignancies or evaluation of dyspnea—small nodules are common and often incidental. For these patients, Brock:[4], [3], [1]
- Provides a repeatable method to estimate malignancy risk.[2], [1]
- Supports decisions on surveillance, PET‑CT, or invasive sampling.[7], [3], [1], [2]
- Helps prioritize which nodules to discuss in MDT.[12], [1]
The 2024 review on incidental pulmonary nodules notes that validated risk models such as Brock are particularly valuable in this heterogeneous group, provided local prevalence and patient context are considered.[3], [2]
4.3 Persistent Indeterminate Nodules and Pre‑operative Assessment
For persistent nodules that remain indeterminate after initial CT follow‑up, Brock can:
- Quantify how risk has evolved as size or morphology changes.[1], [3]
- Inform pre‑operative decision‑making by clarifying malignancy probability.[13], [1]
- Support shared decisions about non‑surgical options (e.g., SBRT).[13], [1]
Recent work on biopsy decision‑making for intermediate–high‑risk nodules highlights the role of prediction models like Brock in refining thresholds for invasive diagnostics.[26], [13]
4.4 Triage to PET‑CT and Herder Modelling
BTS guidelines and subsequent reviews recommend using Brock risk >10% as a trigger for PET-CT, followed by Herder modelling to refine risk and guide intervention. In practice, this creates a two-stage quantitative pathway:[10], [11], [7], [3], [1]
- Stage 1 - Brock on CT: All eligible nodules undergo Brock assessment; those with <=10% risk usually enter CT surveillance.[7], [1]
- Stage 2 - Herder after PET-CT: Nodules with >10% risk undergo PET-CT, and Herder incorporates FDG uptake plus CT features.[11], [7], [1]
OncoToolkit’s calculator is designed to sit at the front of this pathway, giving you an accurate, guideline‑ready Stage‑1 risk estimate in seconds.
5. How the OncoToolkit Brock Nodule Risk Calculator Works
The OncoToolkit interface is deliberately structured to align with how lung oncologists and radiologists already think about nodules, minimizing friction at the point of care.
5.1 Step‑by‑Step Input Workflow
The input page groups fields into patient‑level and nodule‑level sections.
- Age (years)
- Sex
- Family history of lung cancer
- Emphysema presence
- Longest diameter (mm)
- Nodule type (Solid/Semi-Solid/GGN)
- Location & Count
- Spiculation status
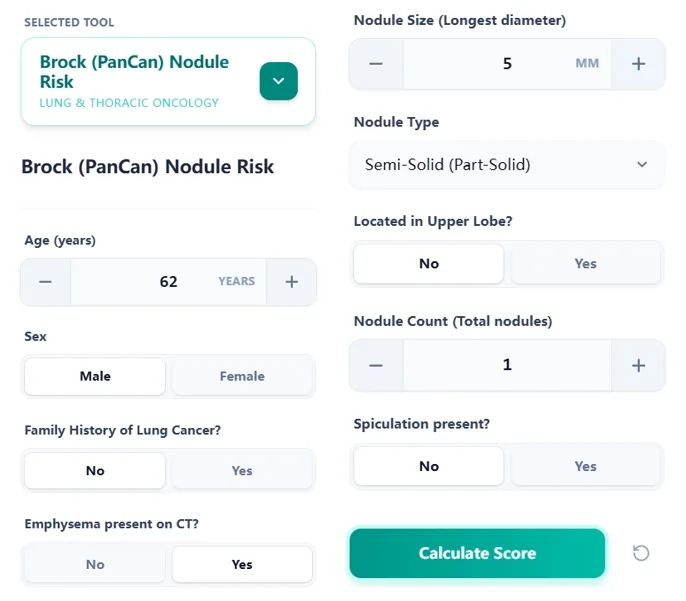
Figure 3. The input form arranged in clinical and radiologic sections.
5.2 Risk Calculation and Threshold Mapping
After clicking “Calculate Score,” the engine:
- Encodes each variable according to the published model.[5]
- Applies the Brock coefficients to compute the logit and derives the probability.[5]
- Maps the resulting probability into the three-band risk strata aligned with BTS/Fleischner.[9], [3], [7], [1]
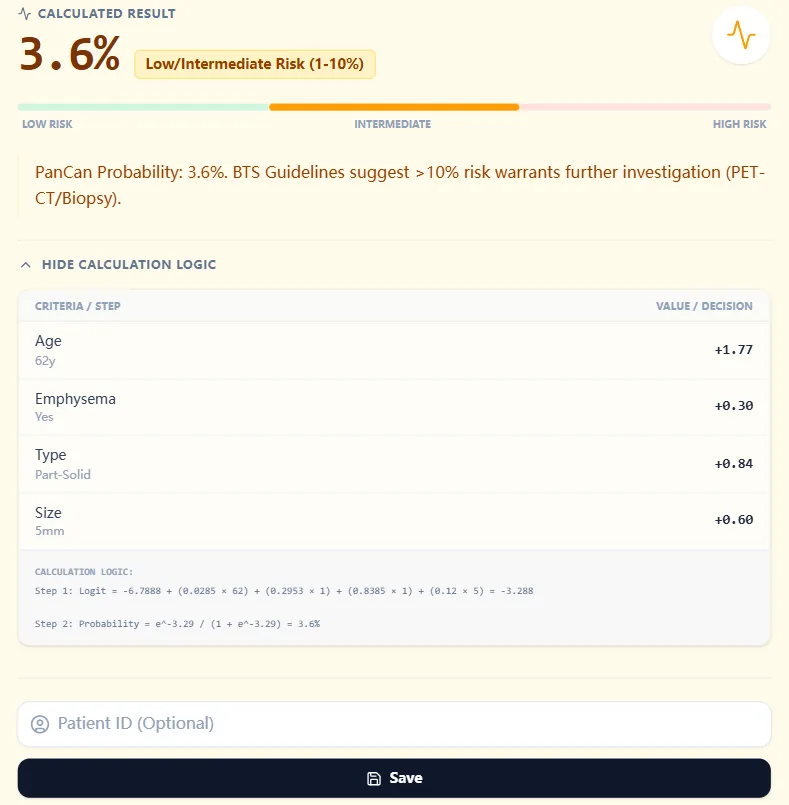
Figure 4. Reference table linking risk probability bands to management suggestions.
5.3 Interpreting the Output
In the example provided, a 62-year-old with emphysema and a 5-mm part-solid nodule yields a Brock probability of 3.6%, categorized as Low/Intermediate Risk (1-10%). The result page displays a colored risk bar, narrative guidance, and the calculation logic breakdown, enabling rapid translation into an action plan.[3], [7], [1]
6. How OncoToolkit Supports Clinical Care, Training, and Research
6.1 Routine Lung Oncology Workflows
For lung oncologists, thoracic surgeons, and MDTs, the calculator can be used to:
- Stratify incidental nodules seen in staging CTs.[2], [1], [3]
- Standardize MDT presentations, so each nodule has a pre-calculated risk band.
- Support shared decision‑making, translating descriptors into risk percentages.[4], [1], [5]
6.2 Education for Fellows and Trainees
The Brock calculator is also a teaching asset:
- Trainees can manipulate variables and see how risk changes.[22], [21], [5]
- The explicit coefficient breakdown demystifies logistic regression.
- Educators can use screenshots of the clinical background and reference table.
6.3 Research, QI, and Data Infrastructure
Standardized risk quantification supports cohort building, guideline adherence audits, and evaluation of model performance in local populations.[1], [3], [5], [8], [2]
7. Recent Expansions, Modifications, and Future Directions
7.1 External Validation, Recalibration, and Meta‑Analyses
Beyond the original PanCan and BCCA cohorts, validations confirm good discrimination but show that calibration can drift, prompting recalibration efforts.[17], [20], [16], [3], [1]
A 2025 meta‑analysis synthesizing data from over 50,000 nodules confirms pooled c‑statistics in the 0.84–0.92 range, positioning Brock as a benchmark.[19], [20], [23], [24], [25], [18]
7.2 Integration with Radiomics and AI‑Driven Models
Research explores combining Brock variables with radiomic features or deep learning outputs. Guidelines still favour transparent, interpretable models like Brock, with AI tools viewed as adjuncts.[25], [3]
7.3 Evolving Guideline Landscapes
2023–2024 overviews reiterate the importance of validated risk models, highlighting Brock as one of the best‑studied options for structuring follow‑up and escalation.[8], [3], [12], [2]
8. Frequently Asked Clinical Questions
Ready to Simplify Your Nodule Risk Assessment?
Quantify malignancy risk with our BTS-aligned Brock Calculator.
Use the Calculator Now
Free to use • No registration required
References
- Gould MK, et al. Evaluation of individuals with pulmonary nodules. Source
- German S3-Guideline. Lung Cancer Management. Source
- Review on Incidental Pulmonary Nodules. Source
- American Family Physician. Pulmonary Nodule Evaluation. Source
- McWilliams A, et al. Probability of Cancer in Pulmonary Nodules. Source
- Pan-Canadian Early Detection of Lung Cancer Study. Source
- BTS Guidelines for Pulmonary Nodules. Source
- DZL Publication on Nodule Management. Source
- Fleischner Society 2017 Guidelines. Source
- British Thoracic Society Nodule Management Library. Source
- Radiology Assistant: BTS Nodule Guidelines. Source
- Clinical Imaging Review 2023. Source
- Surgical Decision Making in Nodule Management. Source
- Cognitive Load in Medical Decision Making. Source
- Human Factors in Clinical Calculators. Source
- NLST Brock Recalibration Study. Source
- UCLA QCB: Brock Model Validation. Source
- Clinical Radiology: Meta-analysis 2024. Source
- Global Nodule Risk Meta-analysis 2025. Source
- ECU Research Online: Brock Performance. Source
- Lung-RADS vs. Brock Comparison. Source
- PLOS ONE: Nodule Risk Stratification. Source
- Frontiers in Oncology: AI vs. Brock 2025. Source
- RSNA 2025: Deep Learning for Lung Risk. Source
- Interpretable AI in Thoracic Oncology. Source
- Biopsy Decision Thresholds for Nodules. Source