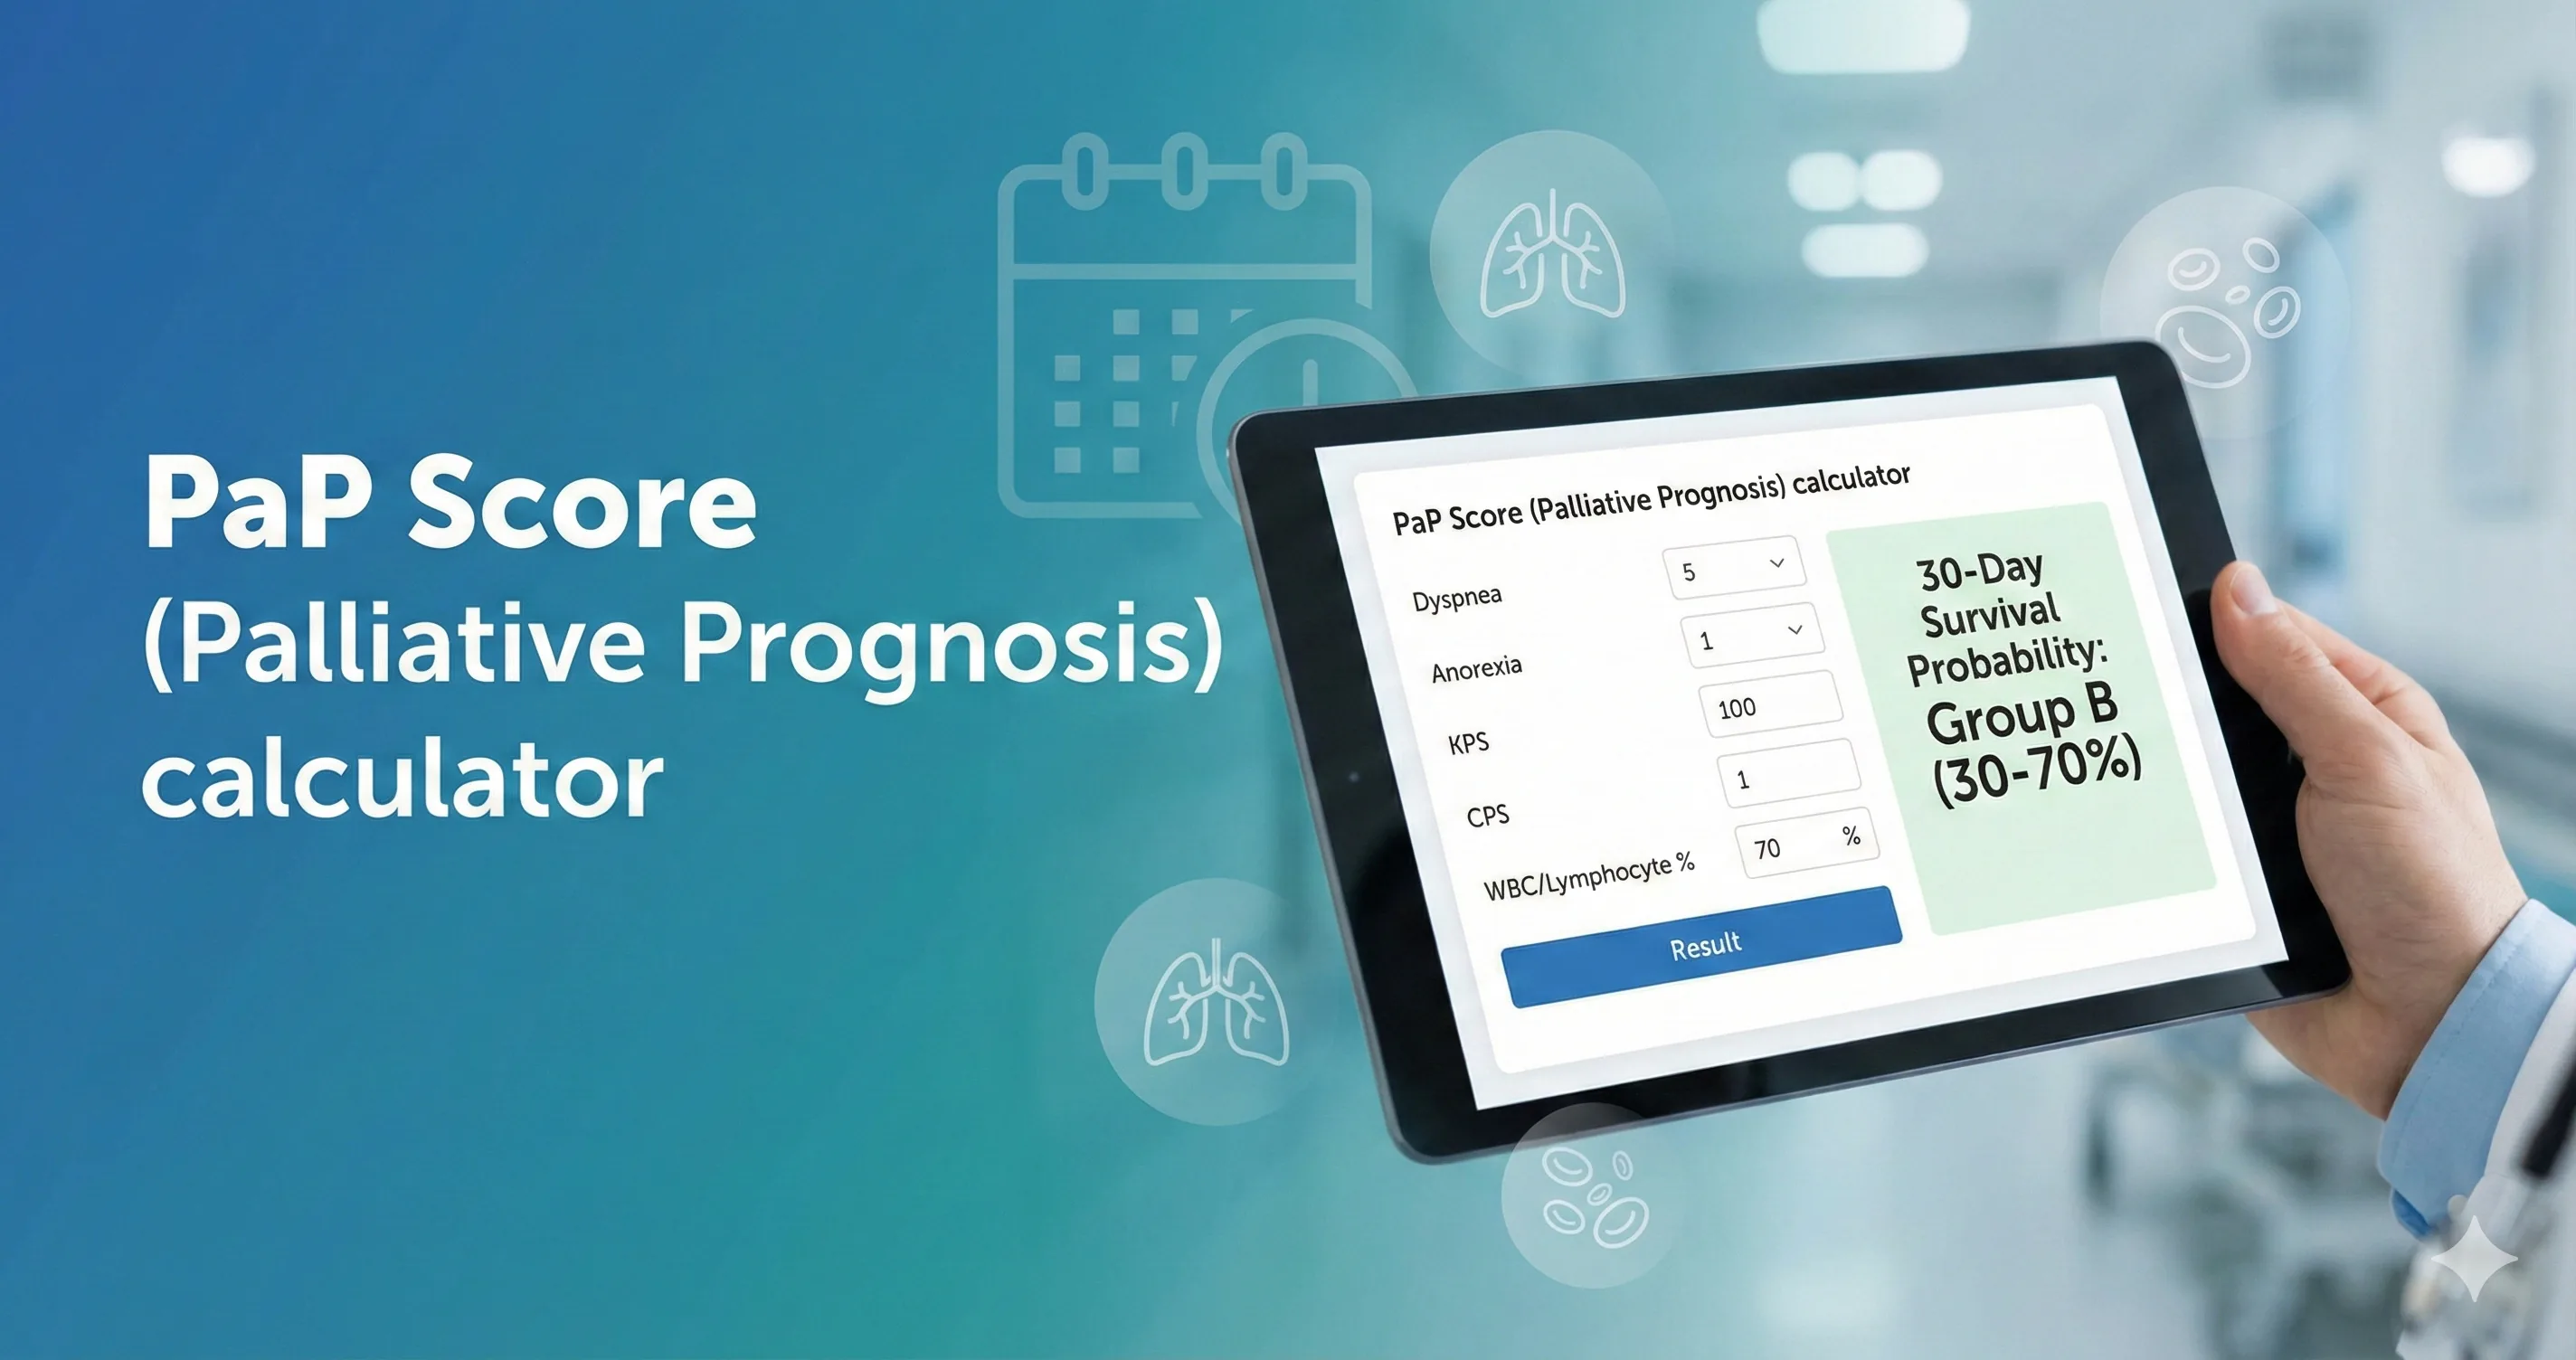
PaP Score (Palliative Prognosis) calculator: evidence‑based 30‑day survival estimates for palliative care
Accurately estimating short‑term survival in advanced cancer is central to good palliative care. The PaP Score combines clinician judgment with objective clinical and hematologic parameters.
Quick Navigation
- 1. Introduction
- 2. What is the PaP Score (Palliative Prognosis)?
- 3. Why the PaP Score matters in palliative and hospice practice
- 4. Clinical evidence and validation of the PaP Score
- 5. How the PaP Score calculator on OncoToolkit works
- 6. How OncoToolkit supports clinical care, education, and research
- 7. Clinical FAQ for the PaP Score (Palliative Prognosis)
- 8. Call to Action
1. Introduction
Accurately estimating short‑term survival in advanced cancer is central to good palliative care, yet it remains one of the most cognitively demanding tasks for hospice and palliative care clinicians. Clinicians must integrate symptoms, performance status, laboratory values, and patient trajectory, all while communicating clearly with patients and families and coordinating complex care decisions.[1], [2], [3]
The Palliative Prognostic (PaP) Score is one of the most widely validated tools for predicting 30‑day survival in terminally ill cancer patients, combining clinician judgment with objective clinical and hematologic parameters to stratify patients into three risk groups with distinct survival probabilities. At OncoToolkit, we’ve built a PaP Score (Palliative Prognosis) calculator that streamlines this scoring system into a mobile‑friendly, point‑of‑care interface, helping hospice and palliative care teams generate transparent, reproducible 30‑day survival estimates in seconds.[4], [5], [6]
You can open the calculator here: /calculator/palliative-prognostic-pap-score.
2. What is the PaP Score (Palliative Prognosis)?
The PaP Score was originally developed by Pirovano and colleagues in a multicenter prospective study of 519 terminally ill cancer patients, with the goal of creating a simple yet robust prognostic index for 30‑day survival in palliative care settings. Through multivariable modeling and backward selection from 36 candidate variables, the investigators derived a parsimonious score built on six predictors:[7], [4]
- Clinical Prediction of Survival (CPS) – clinician’s estimate of survival in categories.
- Karnofsky Performance Status (KPS).
- Presence of dyspnea.
- Presence of anorexia.
- Total white blood cell (WBC) count.
- Lymphocyte percentage.[5], [4]
Each variable is assigned a weighted partial score, and the sum yields a total PaP Score ranging from 0 to 17.5, which is then mapped to three risk groups (A, B, C) with corresponding 30‑day survival probabilities. In the original and subsequent validation studies, these risk groups correlated strongly with 30‑day mortality, providing a clinically meaningful framework for prognosis discussions and care planning.[8], [9], [6], [10], [4], [5]
Over the past two decades, the PaP Score has been repeatedly validated across hospice and palliative care units, in both Western and Asian cohorts, and has been refined with nomogram‑based extensions to generate individualized survival probabilities at 15, 30, and 60 days. Many guidelines and expert reviews on prognostication now cite PaP as a core tool for short‑term survival estimation in advanced cancer.[9], [2], [11], [5], [1]
3. Why the PaP Score matters in palliative and hospice practice
Linking prognosis to key clinical decisions
Short‑term survival estimates inform a wide range of clinical and logistical decisions in palliative care:
- Timing and appropriateness of hospice enrollment, including inpatient vs home hospice.[6], [1]
- Prioritization of symptom‑directed treatments versus disease‑modifying therapies in the final weeks of life.[2]
- Discussions about place of death, intensity of monitoring, and anticipated resource needs (e.g., transfusions, parenteral nutrition).[1], [2]
- Eligibility and timing for clinical interventions such as palliative radiotherapy or procedures, where expected survival may determine benefit.[11], [6]
The PaP Score stratifies patients into iso‑prognostic groups with markedly different 30‑day survival probabilities, giving teams a structured starting point for these complex decisions. For example, high‑risk PaP group C patients typically have less than 30% 30‑day survival and very short median survival, while group A patients often live several weeks to months longer.[12], [4], [9], [6]
Reducing cognitive load and “prognostic fatigue”
Without digital support, calculating PaP requires:
- Recalling the exact partial scores for each CPS, KPS, symptom, and lab category.
- Manually summing weighted points, some of which use half‑point increments.
- Remembering the cut‑off ranges for risk groups A, B, and C.
In busy hospice or hospital services, this mental arithmetic competes with many other high‑stakes cognitive tasks, increasing the risk of error and discouraging routine use of the score.[3], [1]
Our digital PaP Score calculator presents each variable as intuitive buttons or dropdowns, automatically performs calculations, and displays results instantly to reduce "calculator fatigue" during ward rounds.
4. Clinical evidence and validation of the PaP Score
The math behind the PaP Score
The original PaP model was derived using multivariate survival analysis identifying six independent predictors associated with 30‑day mortality. A commonly used scheme assigns:[4], [7]
- CPS category with the largest contribution (up to several points), reflecting the high prognostic weight of clinician gestalt.[13], [4]
- KPS category with intermediate weighting, capturing global functional status.
- Dyspnea and anorexia as binary symptoms with modest but meaningful weights.
- WBC count and lymphocyte percentage, each contributing up to about 2–2.5 points depending on thresholds.[10], [5], [4]
PaP total = Dyspnea points + Anorexia points + KPS points + CPS points + WBC points + Lymphocyte % points
Risk groups and survival outcomes
In multiple cohorts, the PaP total score has been mapped into three risk classes:
- Group A (low risk): 0-5.5 points, with >70% probability of surviving 30 days.
- Group B (intermediate risk): 5.6-11.0 points, with 30-70% 30-day survival.
- Group C (high risk): scores above ~11.0-11.5, with <30% 30-day survival.[9], [6], [10]
Limitations and caveats
- Dependence on CPS accuracy: Over‑optimistic clinician estimates can undermine accuracy.[13]
- Cancer‑focused derivation: Evidence is strongest for advanced malignancies.[4], [1]
- Dynamic nature: PaP reflects a single time point and should be repeated if status changes.[1], [2]
5. How the PaP Score calculator on OncoToolkit works
On our platform, the PaP Score calculator guides clinicians step‑by‑step through each variable.
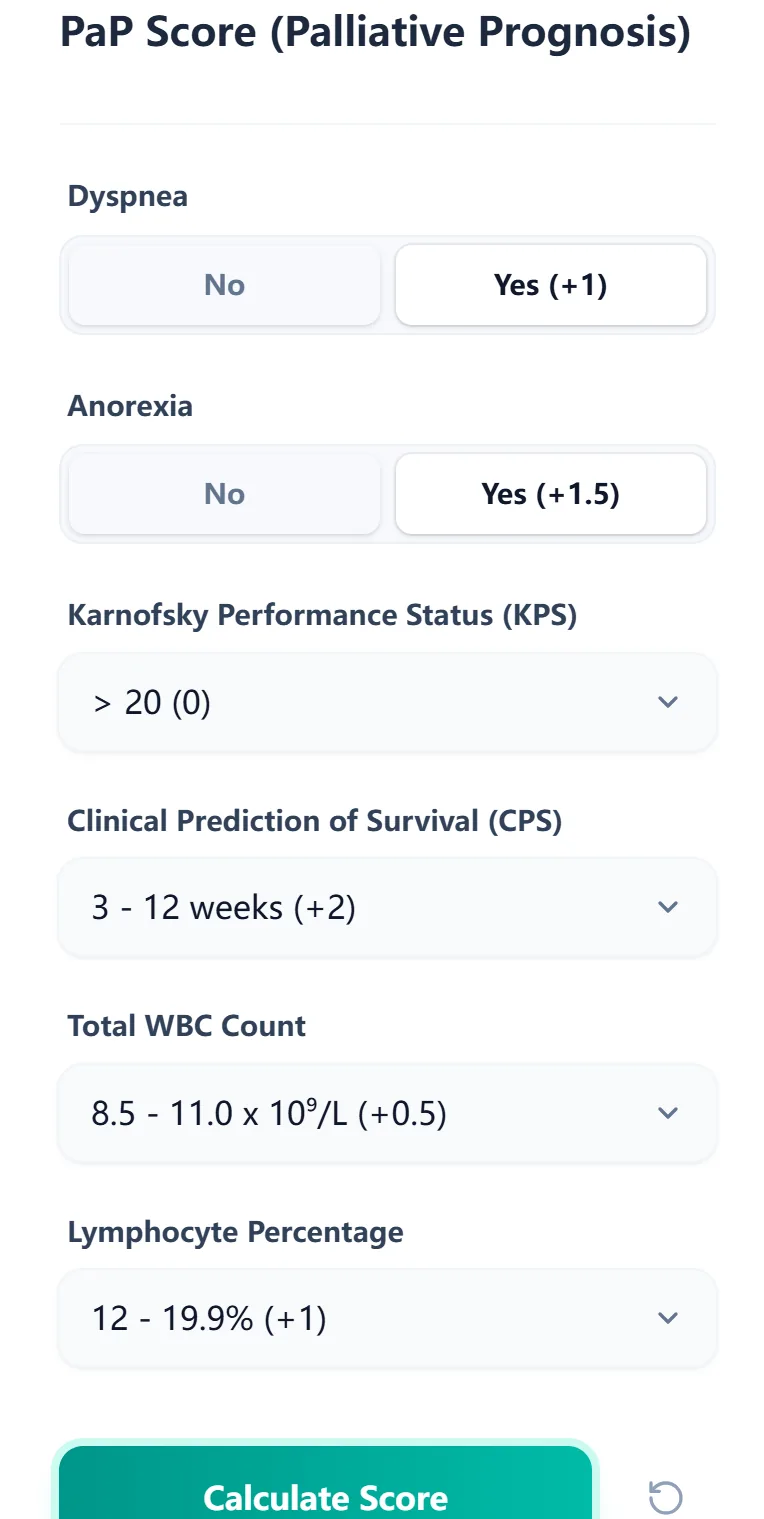
Figure 1. The input form allows fast, error‑resistant data entry.
Step‑by‑step user flow
- Select symptom status: Indicate dyspnea and anorexia presence.
- Enter performance status (KPS): Choose the category from the dropdown.
- Record the CPS: Select the clinician’s estimated survival band.
- Input hematologic data: Enter WBC and lymphocyte percentage.
- Calculate and review results: Generate the total PaP Score and risk group.
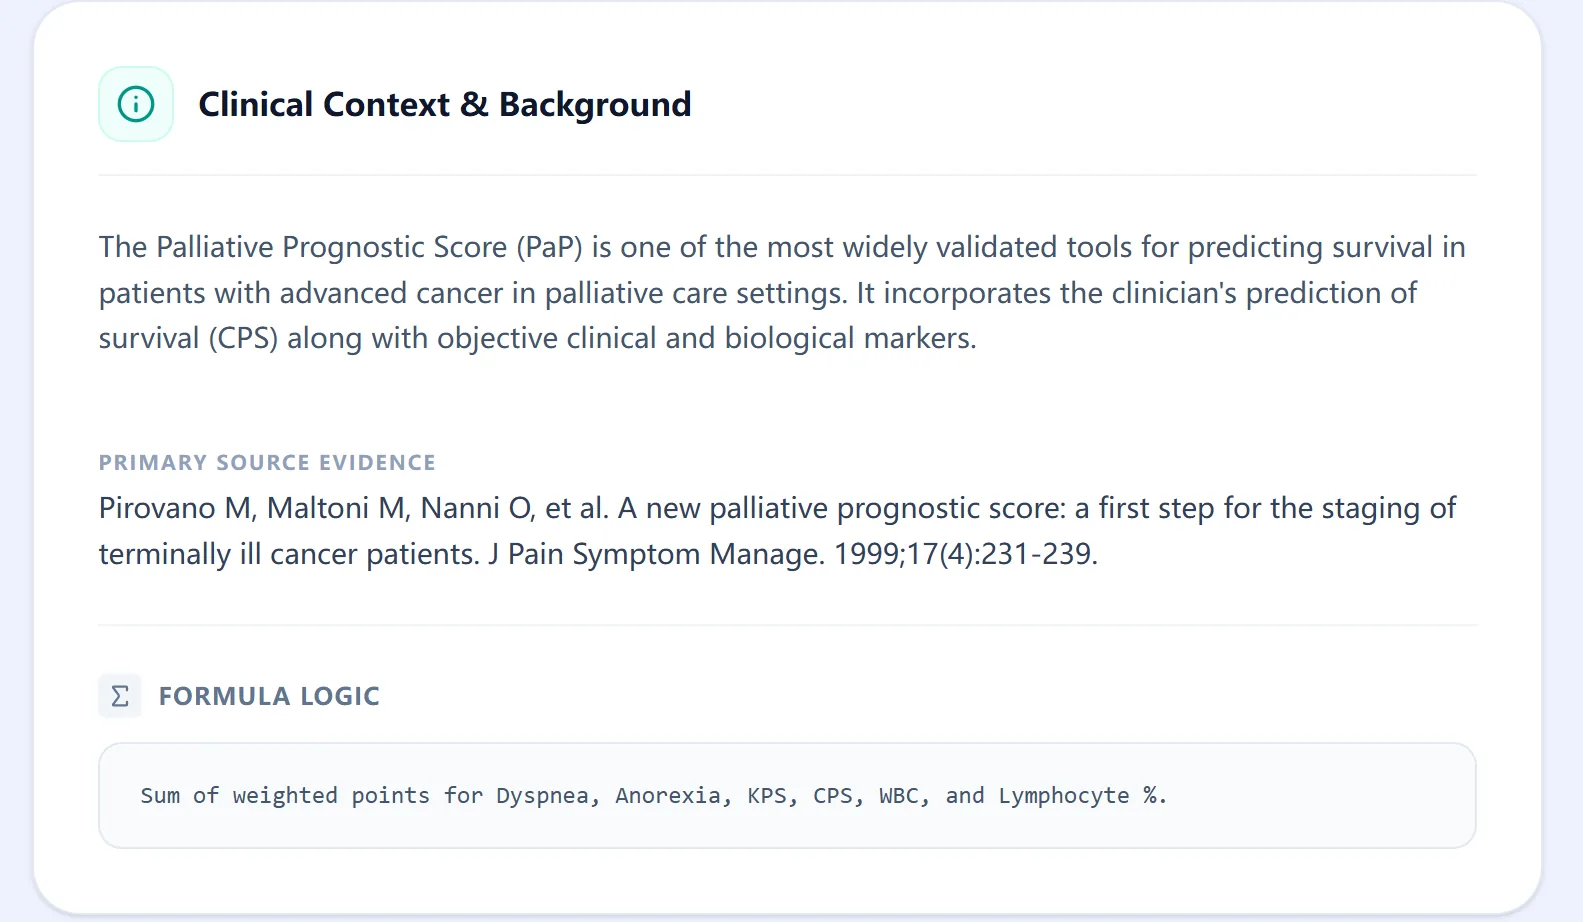
Figure 2. The clinical context panel cites key primary literature.
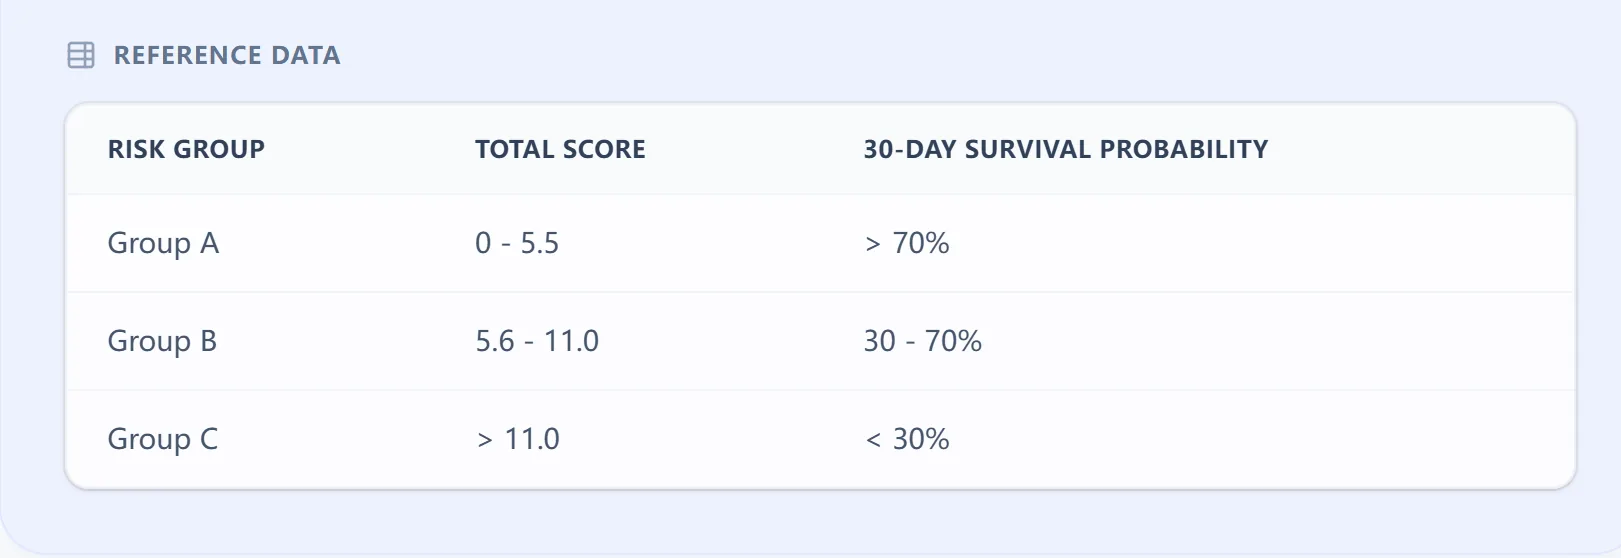
Figure 3. Score ranges mapped to risk groups A–C.
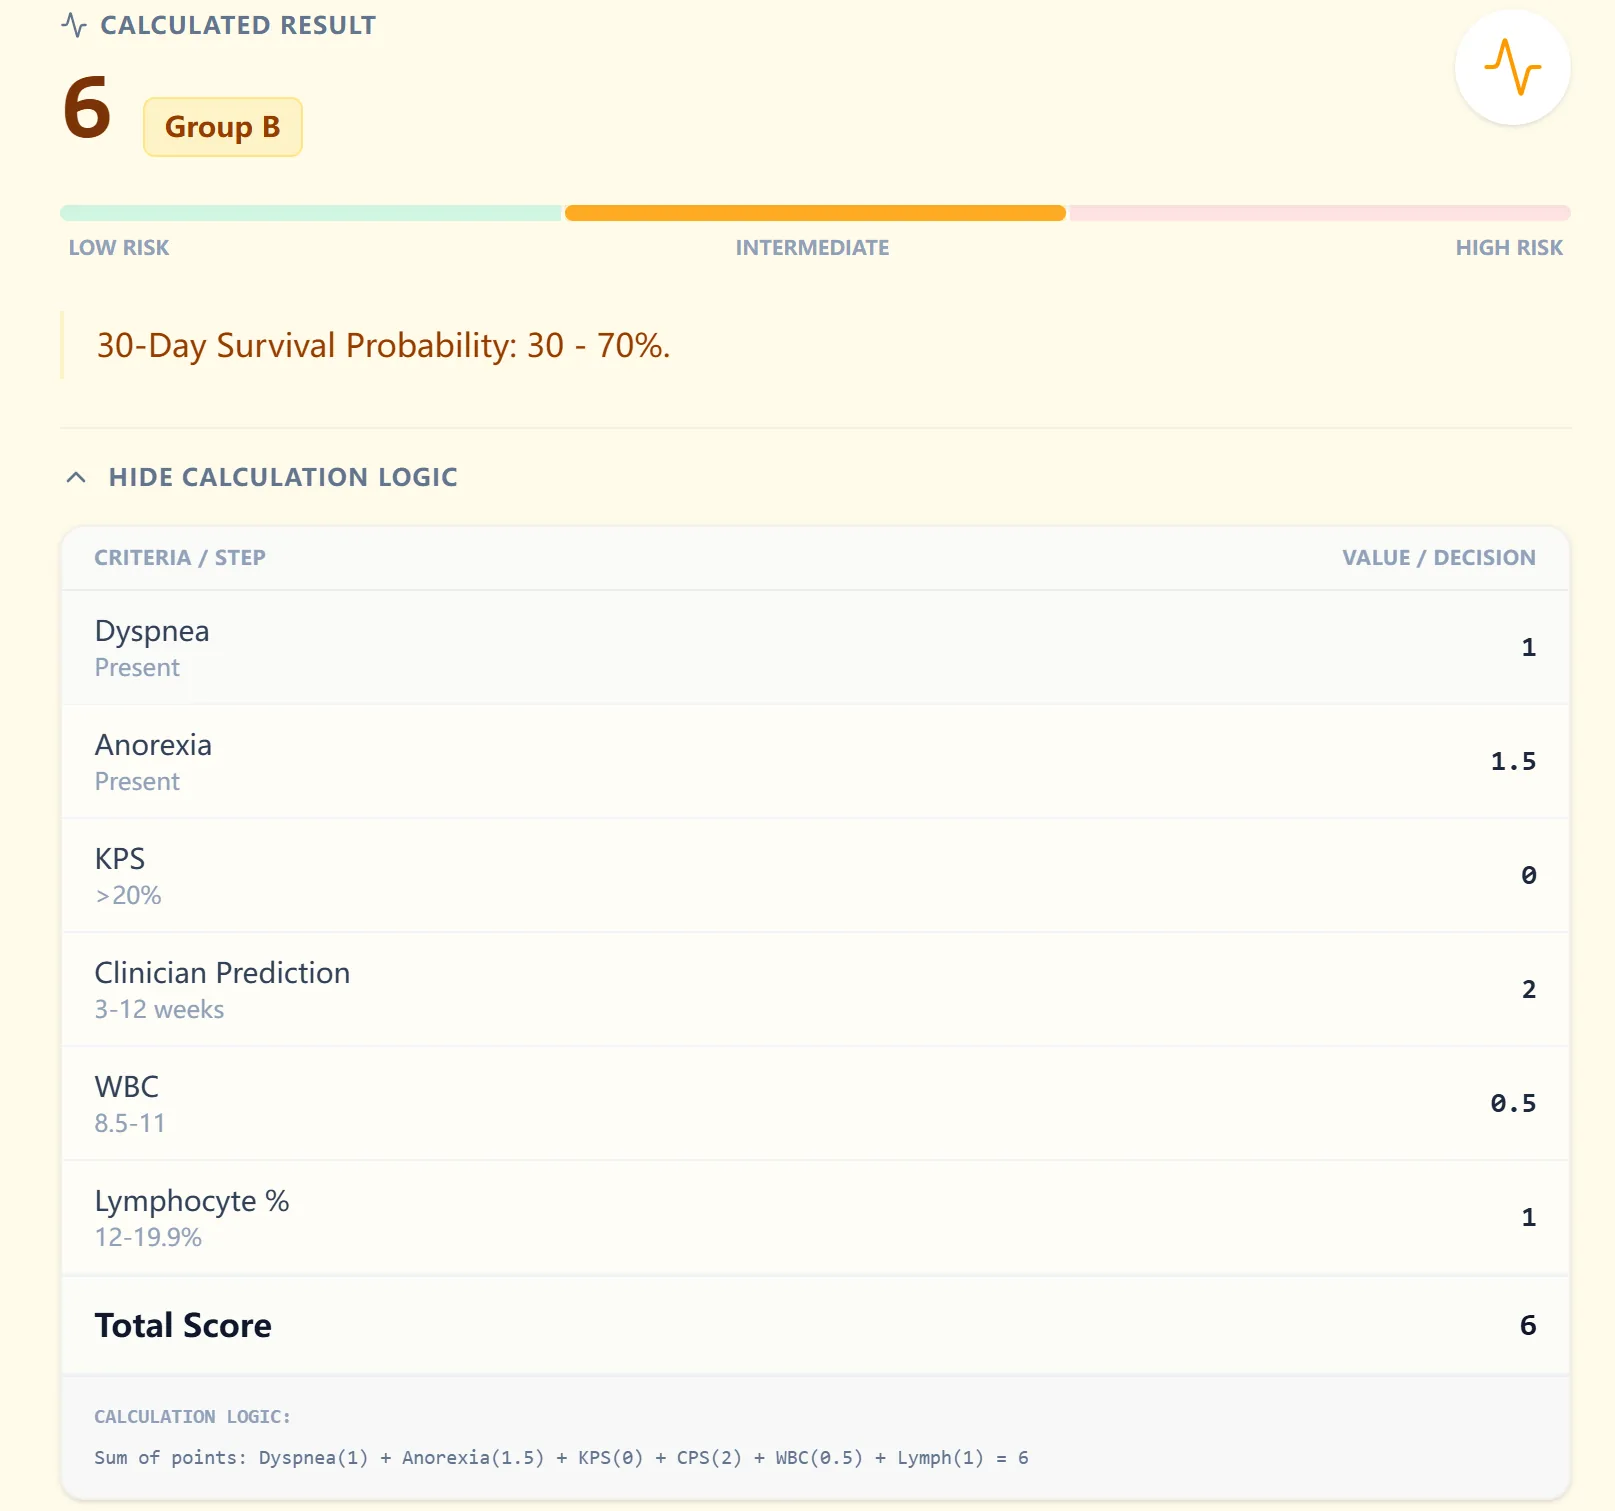
Figure 4. Example patient classification (Group B).
6. How OncoToolkit supports clinical care, education, and research
Routine clinical decision support
In daily practice, our calculator supports admission assessments, MDT discussions, and hospice eligibility transitions. It encourages consistent application of a validated framework over ad-hoc intuition.
Education and simulation for trainees
The calculator functions as an interactive teaching aid, allowing fellows to simulate "what if" scenarios to see how functional declines shift survival probabilities.
Clinical research and quality improvement
The structured nature of the PaP Score is ideal for prospective cohorts, comparative studies, and quality improvement projects aimed at aligning care intensity with patient goals.
7. Clinical FAQ for the PaP Score (Palliative Prognosis)
When should you not use the PaP Score?
Use with caution in non‑malignant terminal illnesses (e.g., heart failure) or in patients receiving highly active anti‑cancer therapy. It is less appropriate if a reliable CPS cannot be obtained.[4], [1], [2], [13]
How does the PaP Score differ from the PPS or PPI?
PaP uniquely combines clinician CPS, symptoms, performance status, and hematologic markers. PPS is performance-based only, while PPI excludes labs and CPS.[3], [14], [1], [4]
Can it be used in patients with significant comorbidities?
Yes, it performs well in cancer populations with comorbidities. Evidence for purely non-cancer conditions is limited.[1], [9], [2], [6], [4]
What is the most common mistake when calculating?
Misclassification of CPS due to optimism bias is the most frequent pitfall. Our calculator labels ranges clearly to mitigate this.[13]
Is the PaP Score validated for both Western and Asian populations?
Yes, multiple studies have validated the score across European and Asian hospice networks.[8], [11], [9], [2]
8. Call to Action
Ready to Simplify Your Palliative Prognosis Calculations?
Generate transparent, reproducible 30-day survival estimates in seconds with our validated clinical tool.
Calculate PaP Score Now
Free to use. No registration required.
References
- MyPCNow. Fast Fact: The Palliative Prognostic Score. Source
- National Center for Biotechnology Information. Source
- Pirovano et al. A new palliative prognostic score: a first step. Source
- PubMed PMID: 10203875. Source
- RNAO. Palliative Prognostic Score (PaP). Source
- PMC4524542. Source
- Bohrium Paper Details. Source
- PubMed PMID: 10203876. Source
- Journal of Agromedicine and Medical Sciences. Source
- End of Life BPG 2011. Source
- PMC9139266 Validation Studies. Source
- MdApp PaP Calculator. Source
- PubMed PMID: 41490668 (CPS Analysis). Source
- PMC6738290 Comparative Tools. Source
- ScienceDirect: Palliative Prognostic Score. Source
- Capes Buscador. Source