Lung Nodule Malignancy Risk Panel: Clinical Decision Support Guide
A comprehensive guide to using the Lung Nodule Malignancy Risk Panel, integrating Mayo, Brock, and Herder models for evidence-based clinical decisions.
Quick Navigation
- Lung Nodule Malignancy Risk Panel Calculator: Clinical Decision Support for Respiratory and Oncology Specialists
The discovery of a pulmonary nodule on chest imaging triggers a complex clinical decision cascade. Should the patient undergo immediate biopsy? Is surveillance appropriate? When should PET-CT be ordered? For respiratory physicians, thoracic surgeons, radiologists, and oncology specialists managing lung nodules daily, these questions demand rapid, evidence-based answers—often during multidisciplinary team (MDT) meetings where time is precious and cognitive load is high.
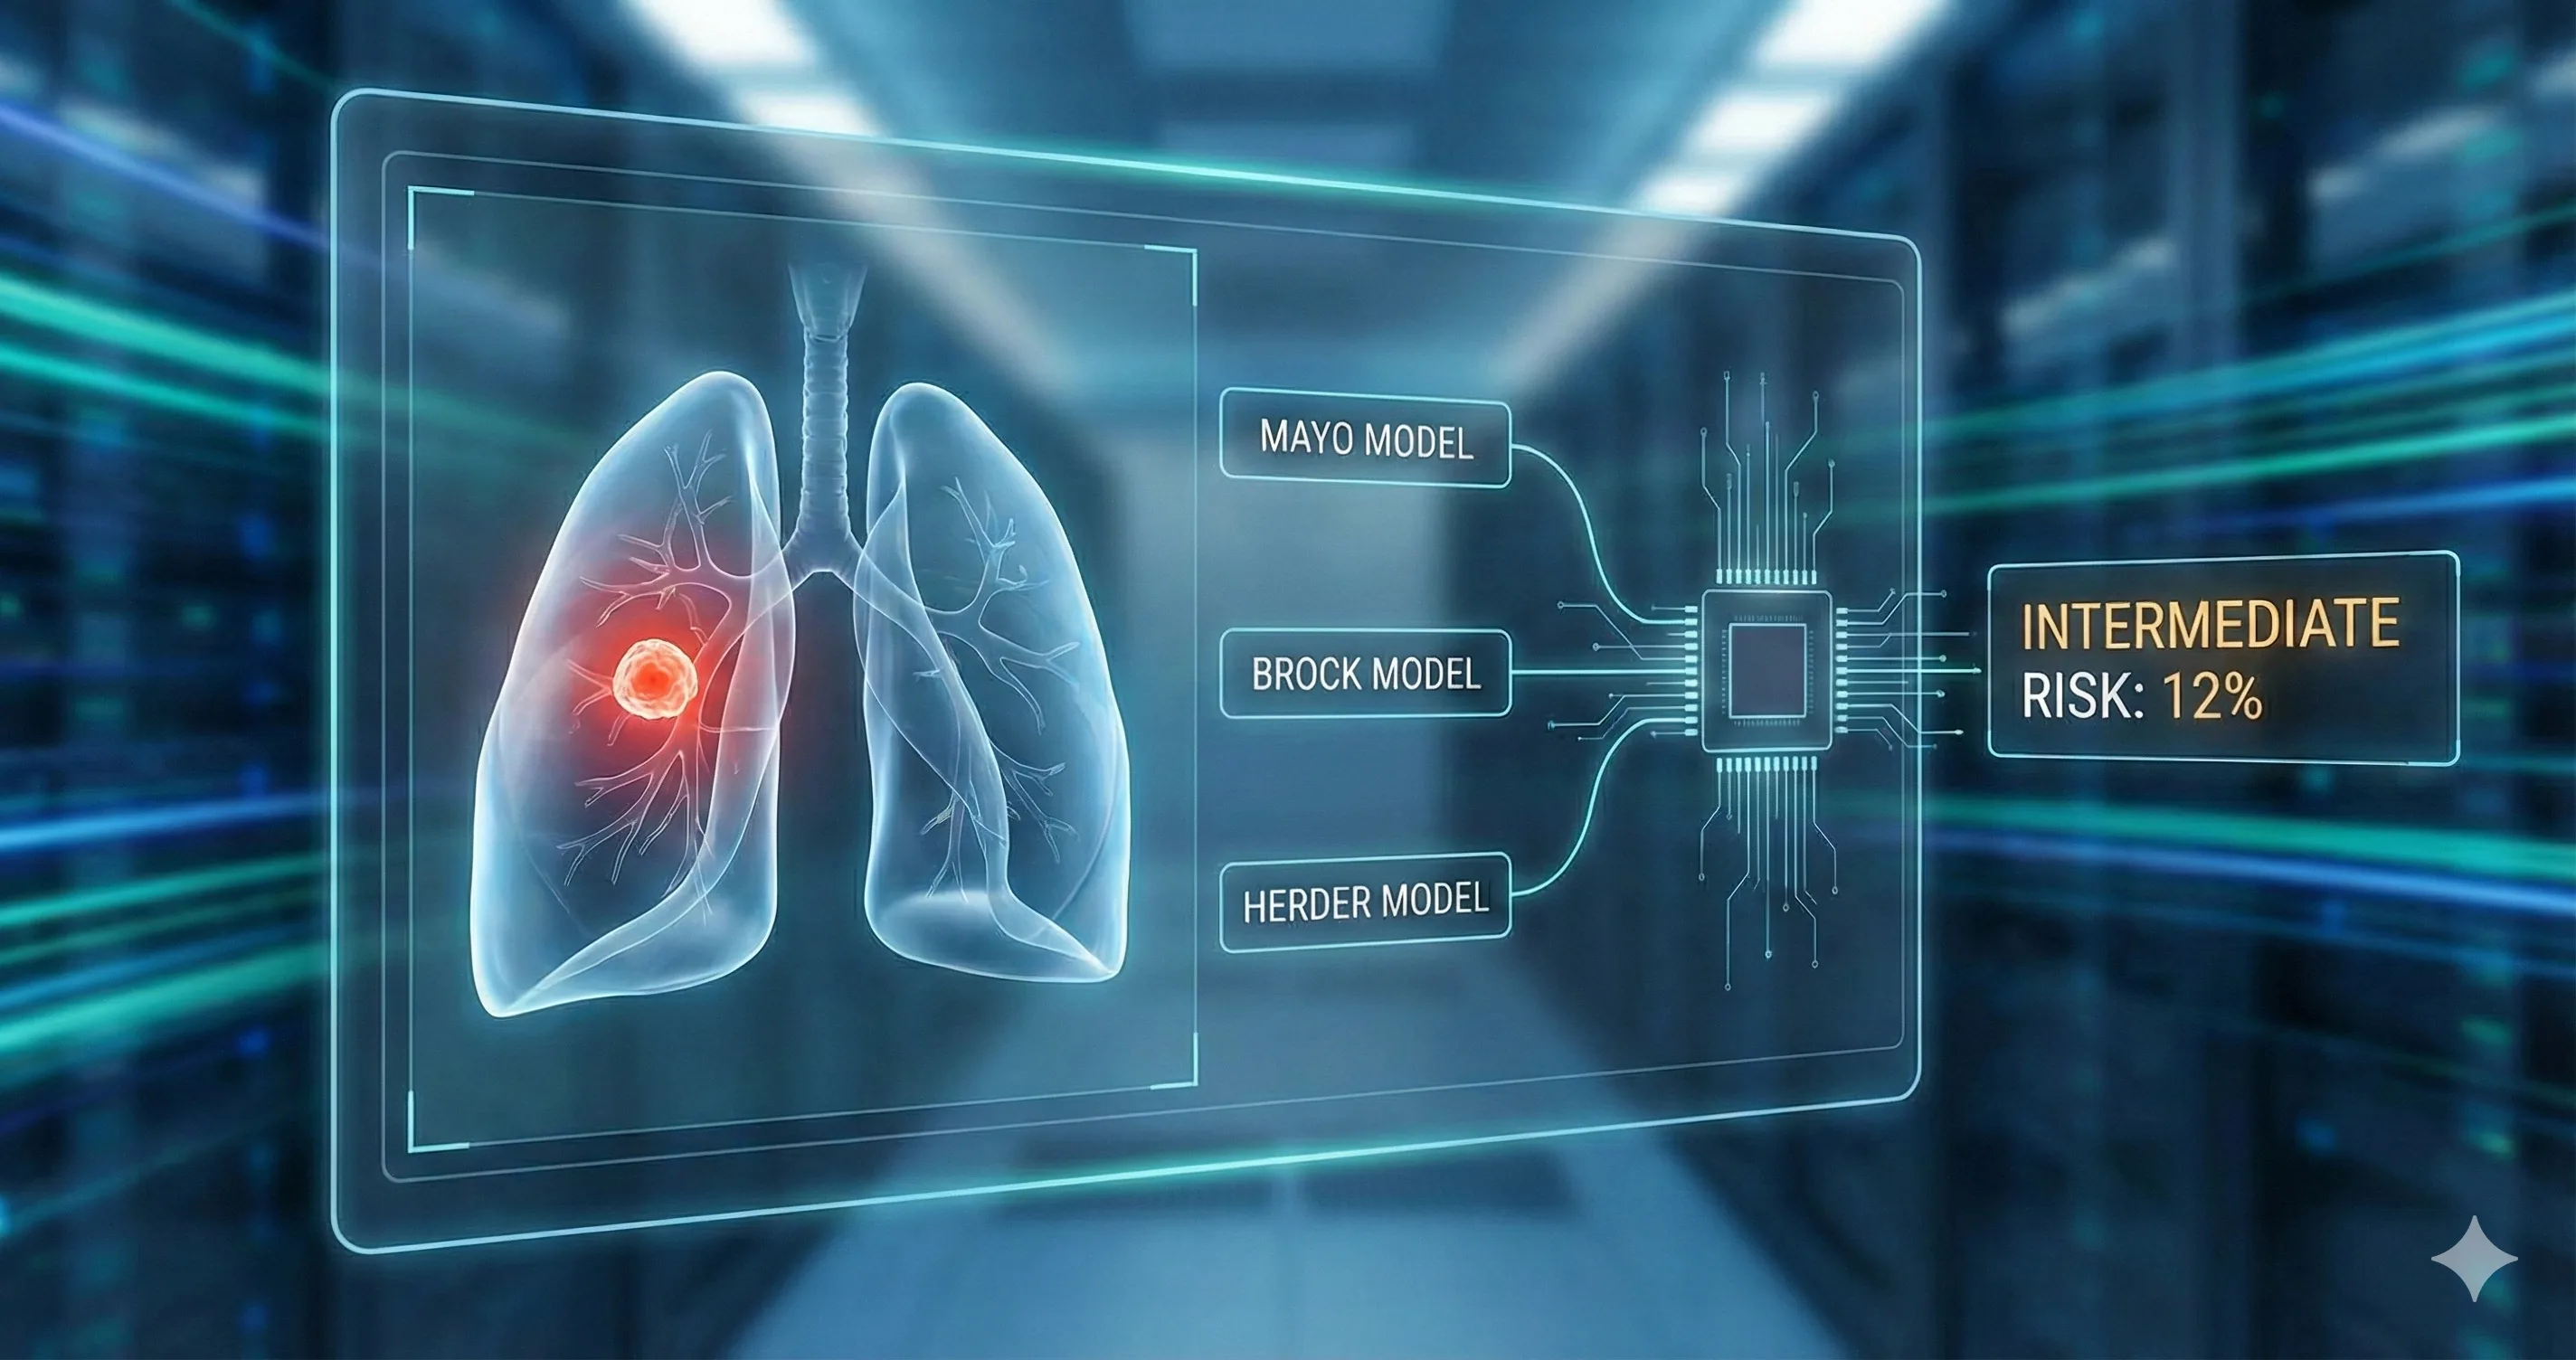
At OncoToolkit, we've built a comprehensive Lung Nodule Malignancy Risk Panel that synthesizes three internationally validated prediction models—Mayo Clinic, Brock (PanCan), and Herder—into a single, mobile-optimized calculator. This tool provides instantaneous malignancy probability estimates alongside guideline-concordant management recommendations, transforming a traditionally time-consuming manual calculation into a streamlined clinical workflow asset. Whether you're preparing for an MDT discussion, counseling a patient in clinic, or teaching trainees about risk stratification, this calculator serves as an essential decision support resource.
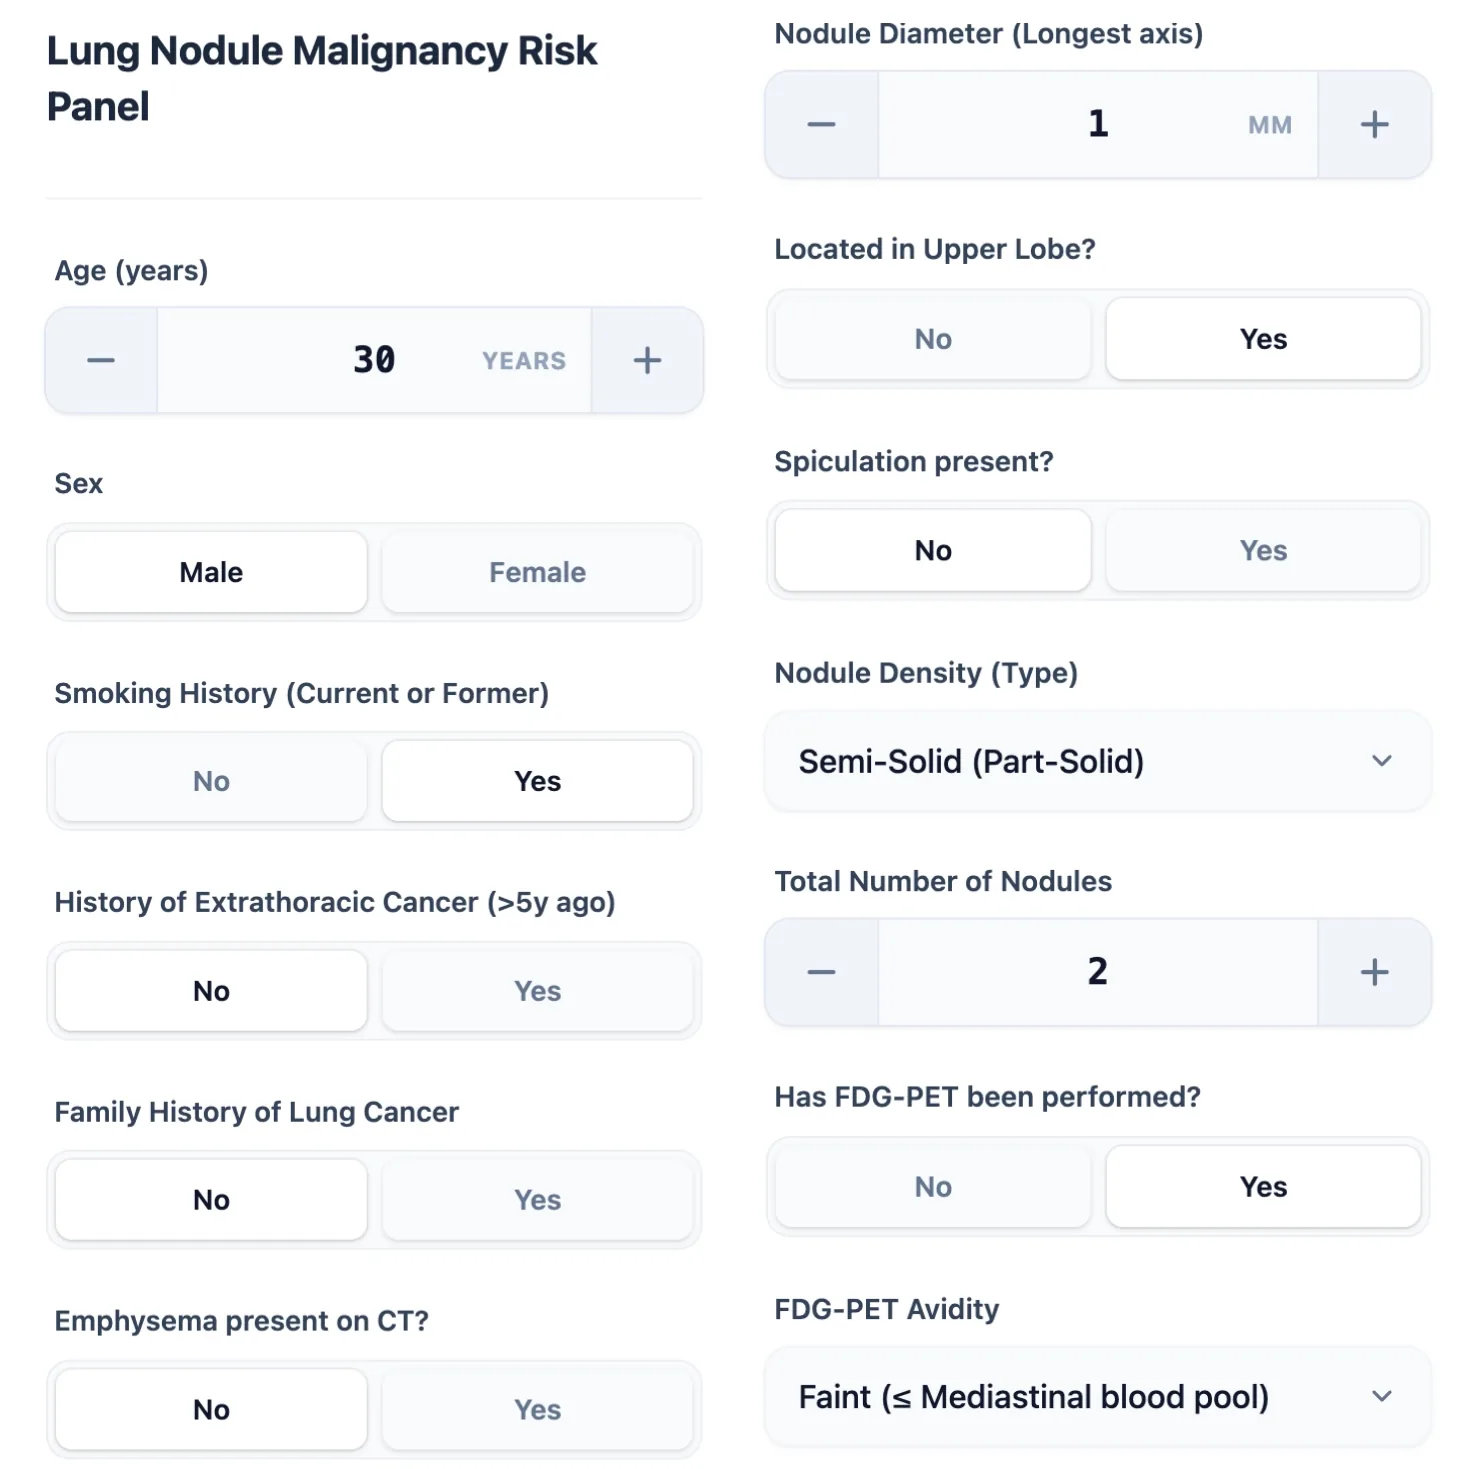
Figure 1. The calculator interface captures essential patient demographics (age, sex, smoking history), nodule characteristics (size, density type, location, spiculation), and metabolic activity.
- What Is the Lung Nodule Malignancy Risk Panel?
The Lung Nodule Malignancy Risk Panel represents an integrated clinical decision support system that simultaneously applies three complementary prediction algorithms to estimate the probability that a solitary pulmonary nodule harbors malignancy. Unlike single-model calculators, this panel approach provides clinicians with multiple evidence-based perspectives, accounting for different clinical contexts and nodule characteristics.
The three constituent models each emerged from distinct patient populations and address specific clinical scenarios. The Mayo Clinic Model (originally published in 1997 and refined in subsequent years) was designed for incidentally detected solid nodules in general medical populations. It incorporates six variables: patient age, smoking history, extrathoracic cancer history more than five years prior, nodule diameter, spiculated margin, and upper lobe location. This model performs optimally when the pretest probability of malignancy falls in the low-to-moderate range.[1], [2]
The Brock (PanCan) Model derives from the Pan-Canadian Early Detection of Lung Cancer Study, a large screening trial that captured data on thousands of nodules detected through low-dose computed tomography (LDCT). This model excels at evaluating sub-solid nodules (part-solid and pure ground-glass lesions) and incorporates additional variables including nodule count, nodule density type, family history of lung cancer, and presence of emphysema. Validation studies demonstrate area under the curve (AUC) values of 0.84–0.90 in screening populations.[3], [4], [1]
The Herder Model extends the Mayo framework by incorporating FDG-PET metabolic activity, achieving significantly improved discrimination (AUC 0.92–0.924) when PET imaging is available. This model is particularly valuable for nodules that fall into the intermediate-risk category (10–70% malignancy probability) where management decisions are most challenging. The British Thoracic Society (BTS) 2015 guidelines recommend applying the Herder model when Brock scores exceed 10%, using PET avidity to refine risk estimates and guide decisions between surveillance, biopsy, and surgical resection.[5], [6], [7], [8], [1]
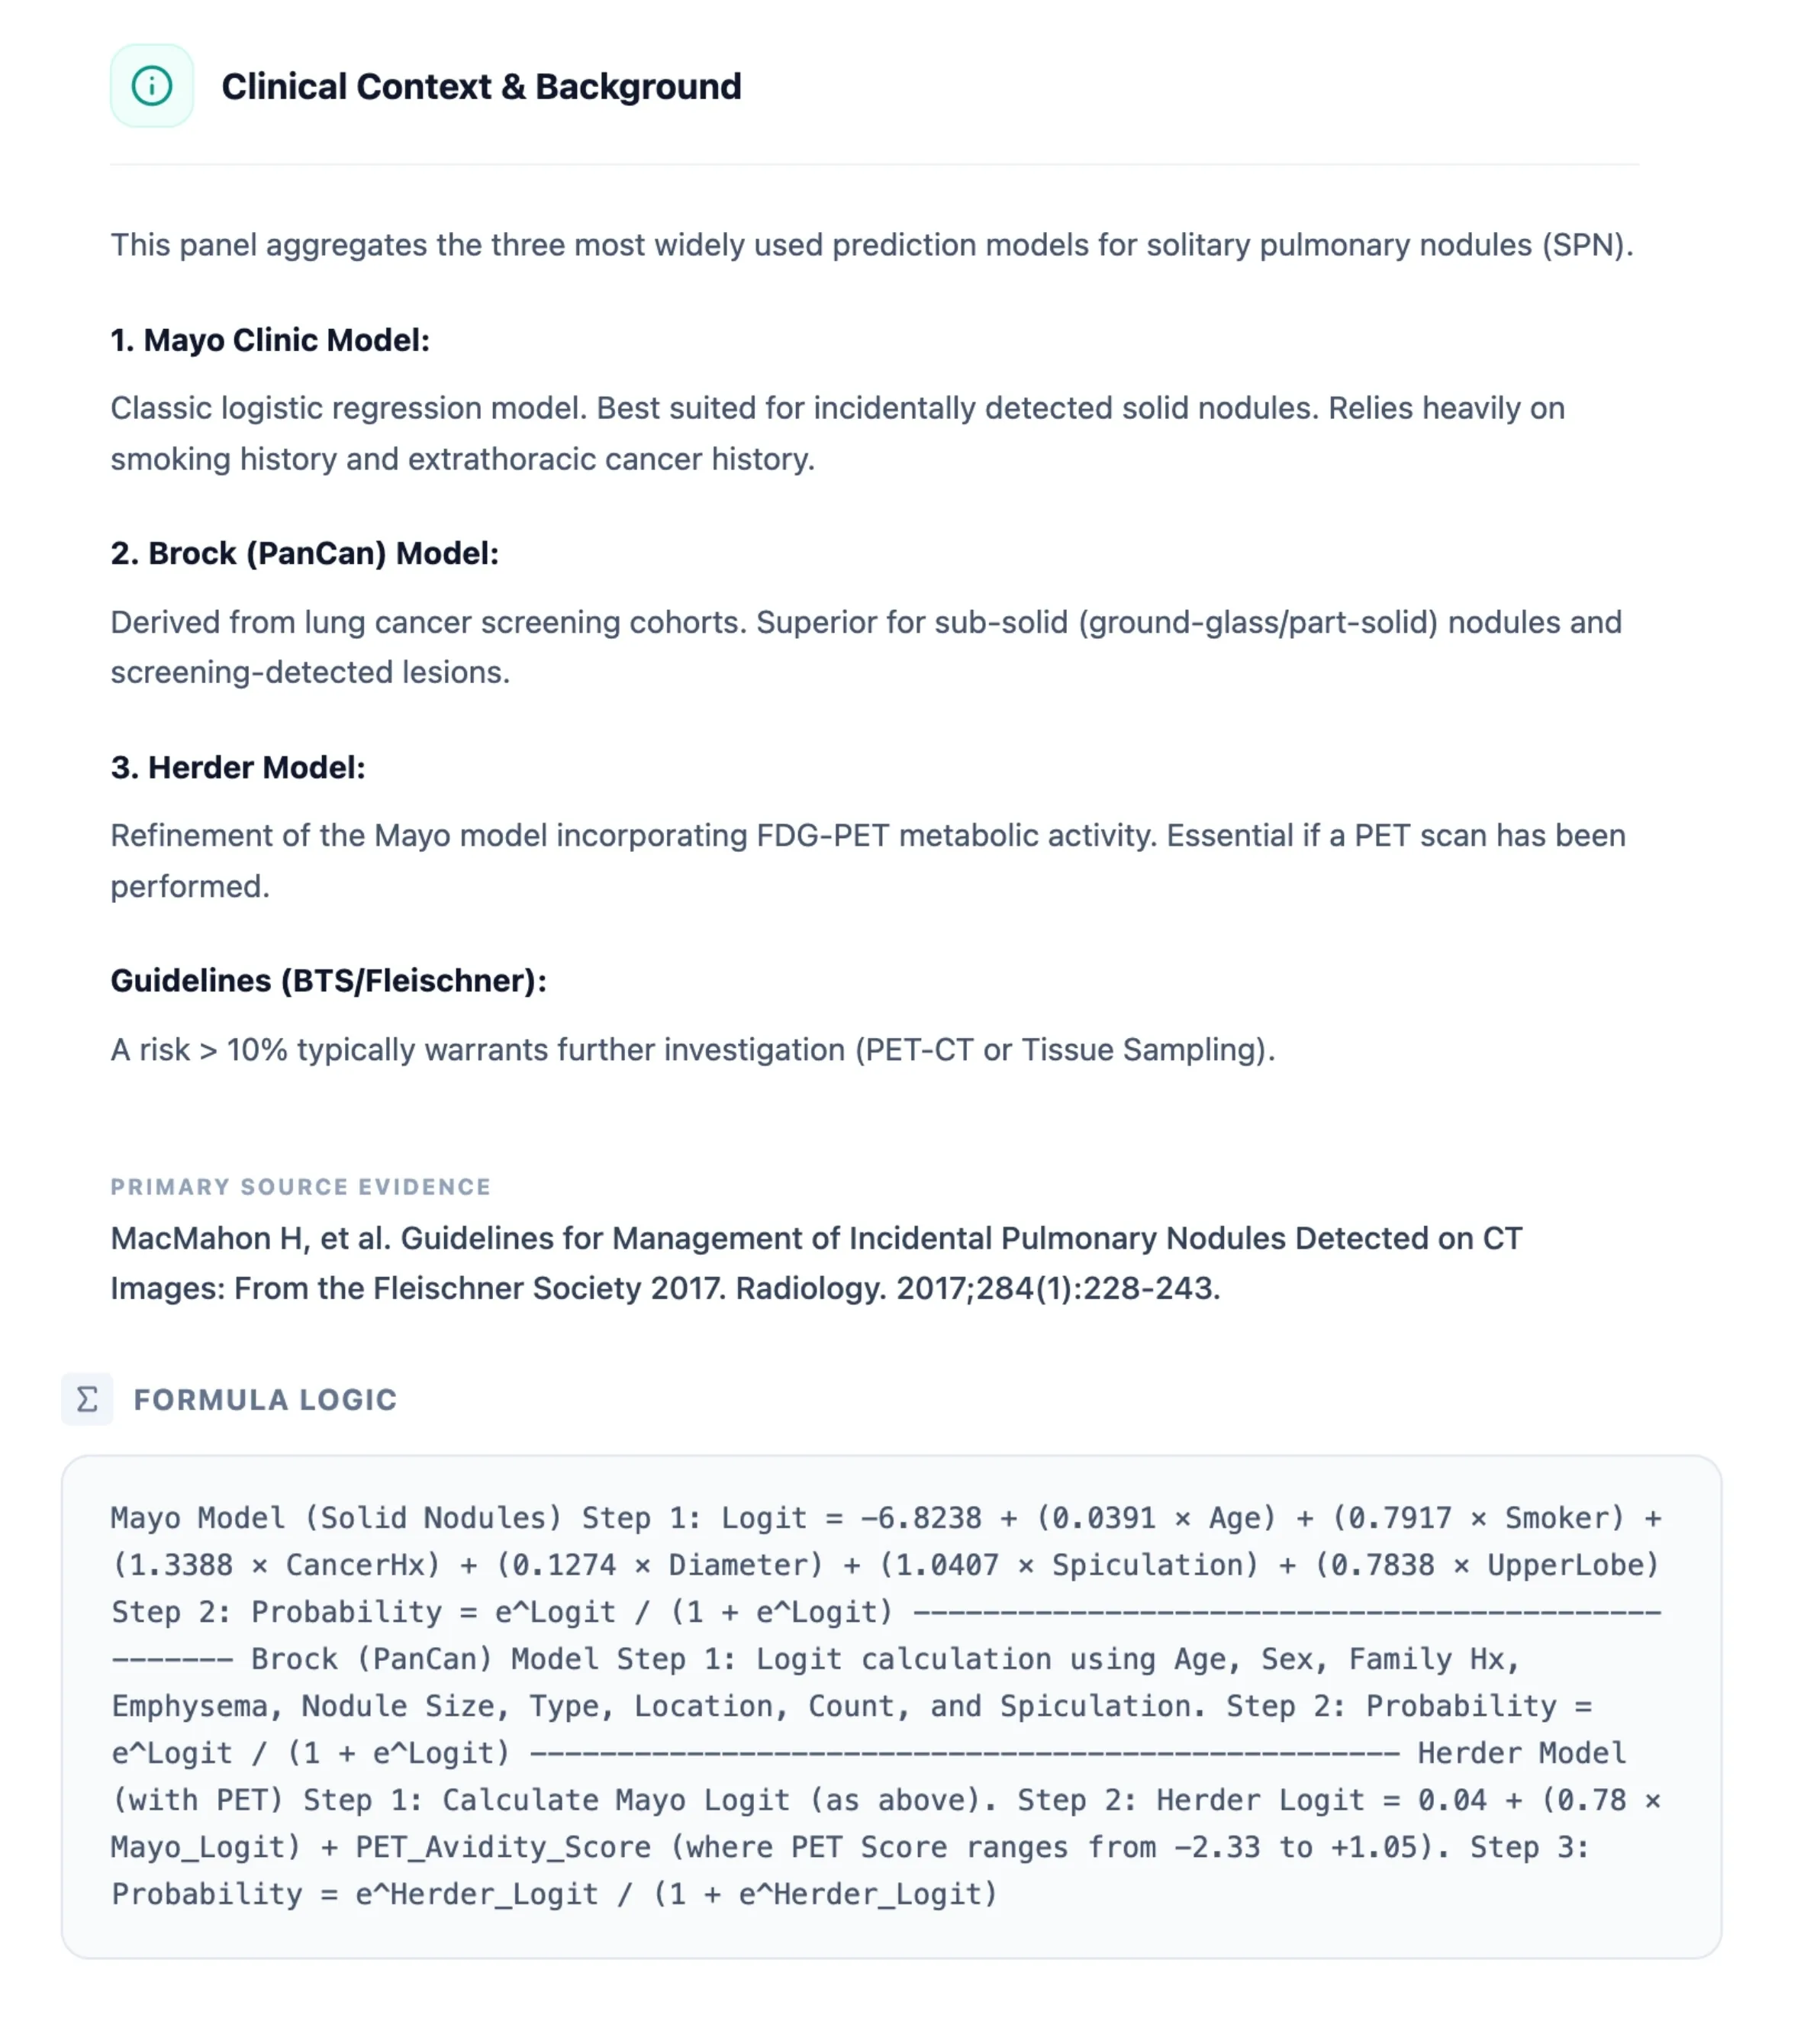
Figure 2. OncoToolkit provides embedded clinical context, summarizing each model's derivation, optimal use cases, and guideline-recommended management thresholds.
- Why the Lung Nodule Malignancy Risk Panel Matters in Practice
3.1 The Clinical Challenge: Decision Fatigue and Calculator Complexity
Pulmonary nodule management epitomizes the modern clinician's challenge: synthesizing multidimensional data under time pressure to make high-stakes decisions. Research on clinical decision fatigue demonstrates that repeated complex decisions throughout the workday impair judgment, decrease diagnostic accuracy, and increase the likelihood of medical errors. For respiratory specialists and thoracic oncologists, the sheer volume of nodule cases—driven by widespread adoption of LDCT screening and incidental detection on imaging for other indications—creates unprecedented cognitive load.[9]
Traditional approaches to nodule risk assessment involve manually extracting patient data from electronic medical records, locating appropriate calculators, inputting variables separately for each model, interpreting probability outputs, and cross-referencing guideline recommendations. This workflow consumes valuable MDT preparation time and introduces opportunities for transcription errors. Studies of multidisciplinary lung cancer teams reveal that pre-meeting preparation represents a significant time burden, with manual data extraction and risk calculation cited as major inefficiencies.[10], [11]
At OncoToolkit, our platform addresses these pain points through intelligent automation and workflow integration. The calculator accepts all necessary inputs through a single interface, performs parallel computations across three models, and displays results with color-coded risk stratification and management recommendations—all within seconds. This efficiency gain is particularly valuable during MDT meetings, where clinicians may discuss 20–30 cases in a 90-minute session. Reducing individual case review time from 5–7 minutes to 2–3 minutes yields meaningful improvements in meeting efficiency and clinician satisfaction.[12], [13]
3.2 Linking Risk Estimates to Treatment Decisions and Patient Outcomes
Accurate malignancy risk stratification directly influences critical management pathways. For nodules with malignancy probability below 5%, surveillance protocols (typically annual CT for 1–2 years) minimize radiation exposure and invasive procedure risks. Intermediate-risk nodules (5–65% in Mayo; 10–70% in Herder) warrant additional investigation—either PET-CT imaging to refine risk estimates or tissue sampling via transbronchial or transthoracic biopsy. High-risk nodules (>65–70% malignancy probability) generally proceed directly to surgical resection or stereotactic body radiotherapy (SBRT) in patients with prohibitive surgical risk.[14], [8], [15]
The clinical consequences of misclassification are substantial. Underestimating malignancy risk delays diagnosis and upstaging of potentially curable lung cancer. Data from the National Lung Screening Trial (NLST) demonstrates that early detection and treatment of stage I lung cancer yields 5-year survival rates exceeding 60%, compared to less than 10% for stage IV disease. Conversely, overestimating risk subjects patients with benign nodules to unnecessary invasive procedures, radiation exposure, and psychological distress. Transthoracic needle biopsies carry pneumothorax rates of 15–25%, with 5–10% requiring chest tube placement.[16], [17]
The Lung Nodule Malignancy Risk Panel mitigates these risks through validated, probabilistic risk stratification. By presenting parallel estimates from three complementary models, the calculator helps clinicians identify concordant versus discordant predictions. For example, a nodule that scores as low-risk on the Mayo model but intermediate-risk on Brock may reflect sub-solid density characteristics that the Mayo model underweights. This discordance prompts closer radiographic review and potentially more conservative management.
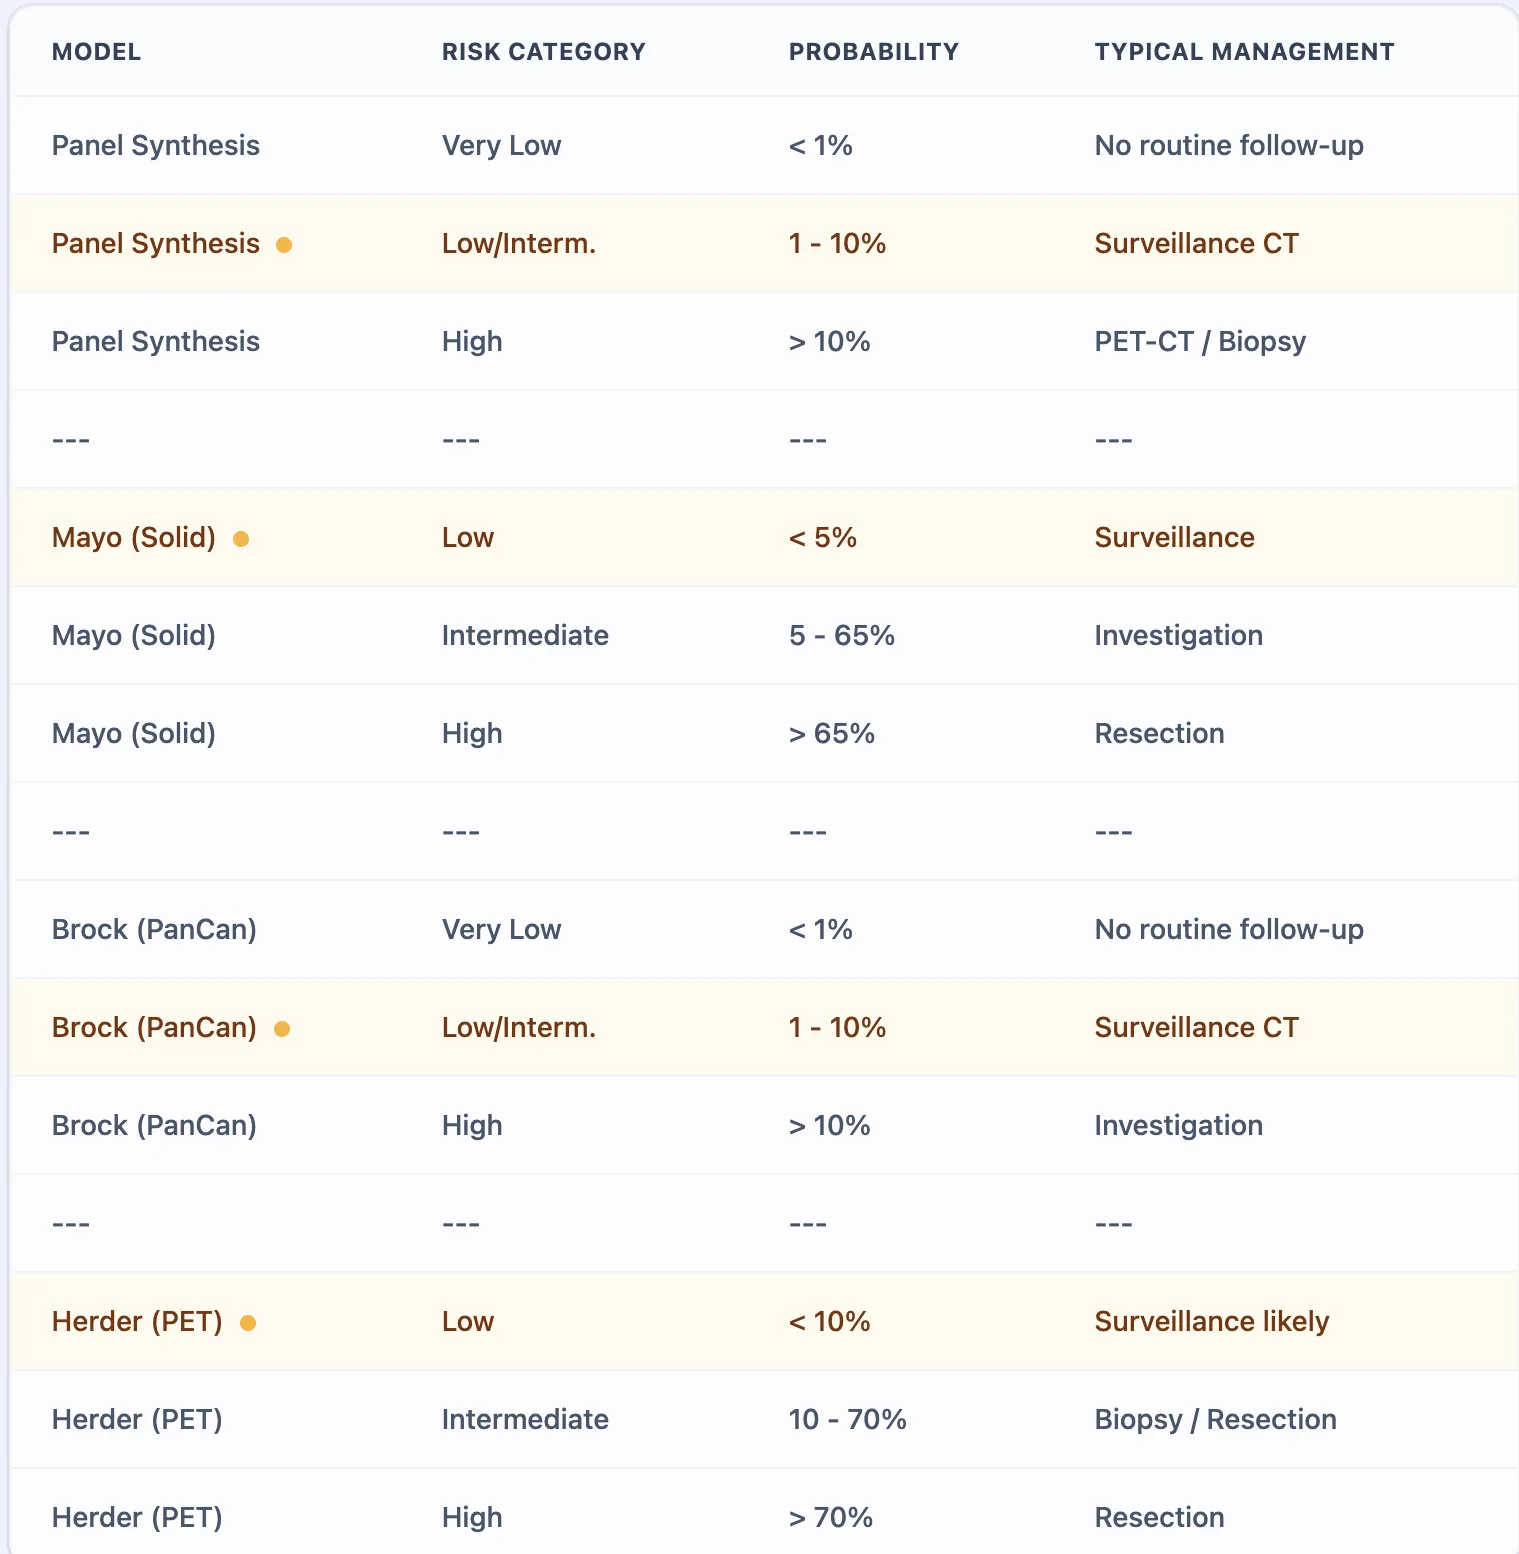
Figure 3. The reference table synthesizes BTS and Fleischner Society guideline recommendations, mapping probability ranges to management actions.
- Clinical Evidence and Validation: The Math Behind the Tool
4.1 Mayo Clinic Model: Logistic Regression for Solid Nodules
Step 1: Calculate the Logit (Log-Odds)
Logit = -6.8238 + (0.0391 * Age) + (0.7917 * Smoking) + (1.3388 * Cancer History) + (0.1274 * Diameter in mm) + (1.0407 * Spiculation) + (0.7838 * Upper Lobe)
Step 2: Convert Logit to Probability
Probability = e^(Logit) / (1 + e^(Logit))
Each coefficient represents the log-odds contribution. For instance, the coefficient of 1.0407 for spiculation indicates that spiculated nodules carry approximately 2.8 times the odds of malignancy compared to smooth-bordered nodules.
4.3 Herder Model: Incorporating FDG-PET Metabolic Activity
Mathematical Formulation
- Step 1: Calculate the Mayo Clinic Logit (using the formula above).
- Step 2: Calculate the Herder Logit
Herder Logit = 0.04 + (0.78 * Mayo Logit) + PET Avidity Score
Note: The PET Avidity Score in this formula ranges from -2.33 (absent) to +1.05 (intense).
- Step 3: Convert to Probability
Probability = e^(Herder Logit) / (1 + e^(Herder Logit))
Adding PET metabolic activity to the clinical-radiographic model increases accuracy significantly, raising the discrimination (AUC) from 0.79 to 0.92. This refinement is essential for nodules in the intermediate-risk category.
The standardized uptake value (SUV) cutoff of 2.5 has traditionally been used to dichotomize PET results. However, this binary threshold oversimplifies a continuous spectrum and yields suboptimal specificity, particularly in regions with high tuberculosis or histoplasmosis prevalence. The Herder model's ordinal visual scoring system (ranging from absent to intense) captures nuance that binary cutoffs miss, improving both positive and negative predictive values.[20], [21]
4.4 Validation Performance Across Populations and Regional Considerations
A critical consideration for Asian clinicians involves understanding how model performance varies by ethnicity and regional disease patterns. Smoking remains a dominant risk factor globally, but Asian populations—particularly East Asian women—demonstrate substantially higher lung cancer incidence among never-smokers compared to Western cohorts. In Singapore, 31.6% of lung cancer patients overall, and 54.5% of those with adenocarcinoma histology, have never smoked. Similar patterns emerge across China, Japan, and Korea.[22]
This epidemiologic reality poses challenges for prediction models that heavily weight smoking history. When a never-smoking 60-year-old Asian woman with a 15mm part-solid nodule is entered into the Mayo calculator, the smoking coefficient contributes zero to the logit score, potentially underestimating her true malignancy risk. Conversely, in tuberculosis-endemic regions, upper lobe location—a predictor weighted heavily in Western-derived models—may reflect post-primary TB scarring rather than cancer, inflating false-positive predictions.[22]
Validation studies in Asian populations reveal mixed results. Phua and colleagues noted that conventional calculators may assign "disproportionately high risk to benign nodules" in Southeast Asian populations with elevated TB prevalence. The Chinese validation by Cui found that radiologist gestalt outperformed all three models (Mayo, Brock, VA) in their cohort. These findings underscore the importance of recognizing that probability outputs represent population-level estimates that must be integrated with individual patient factors and regional disease ecology.[22], [19]
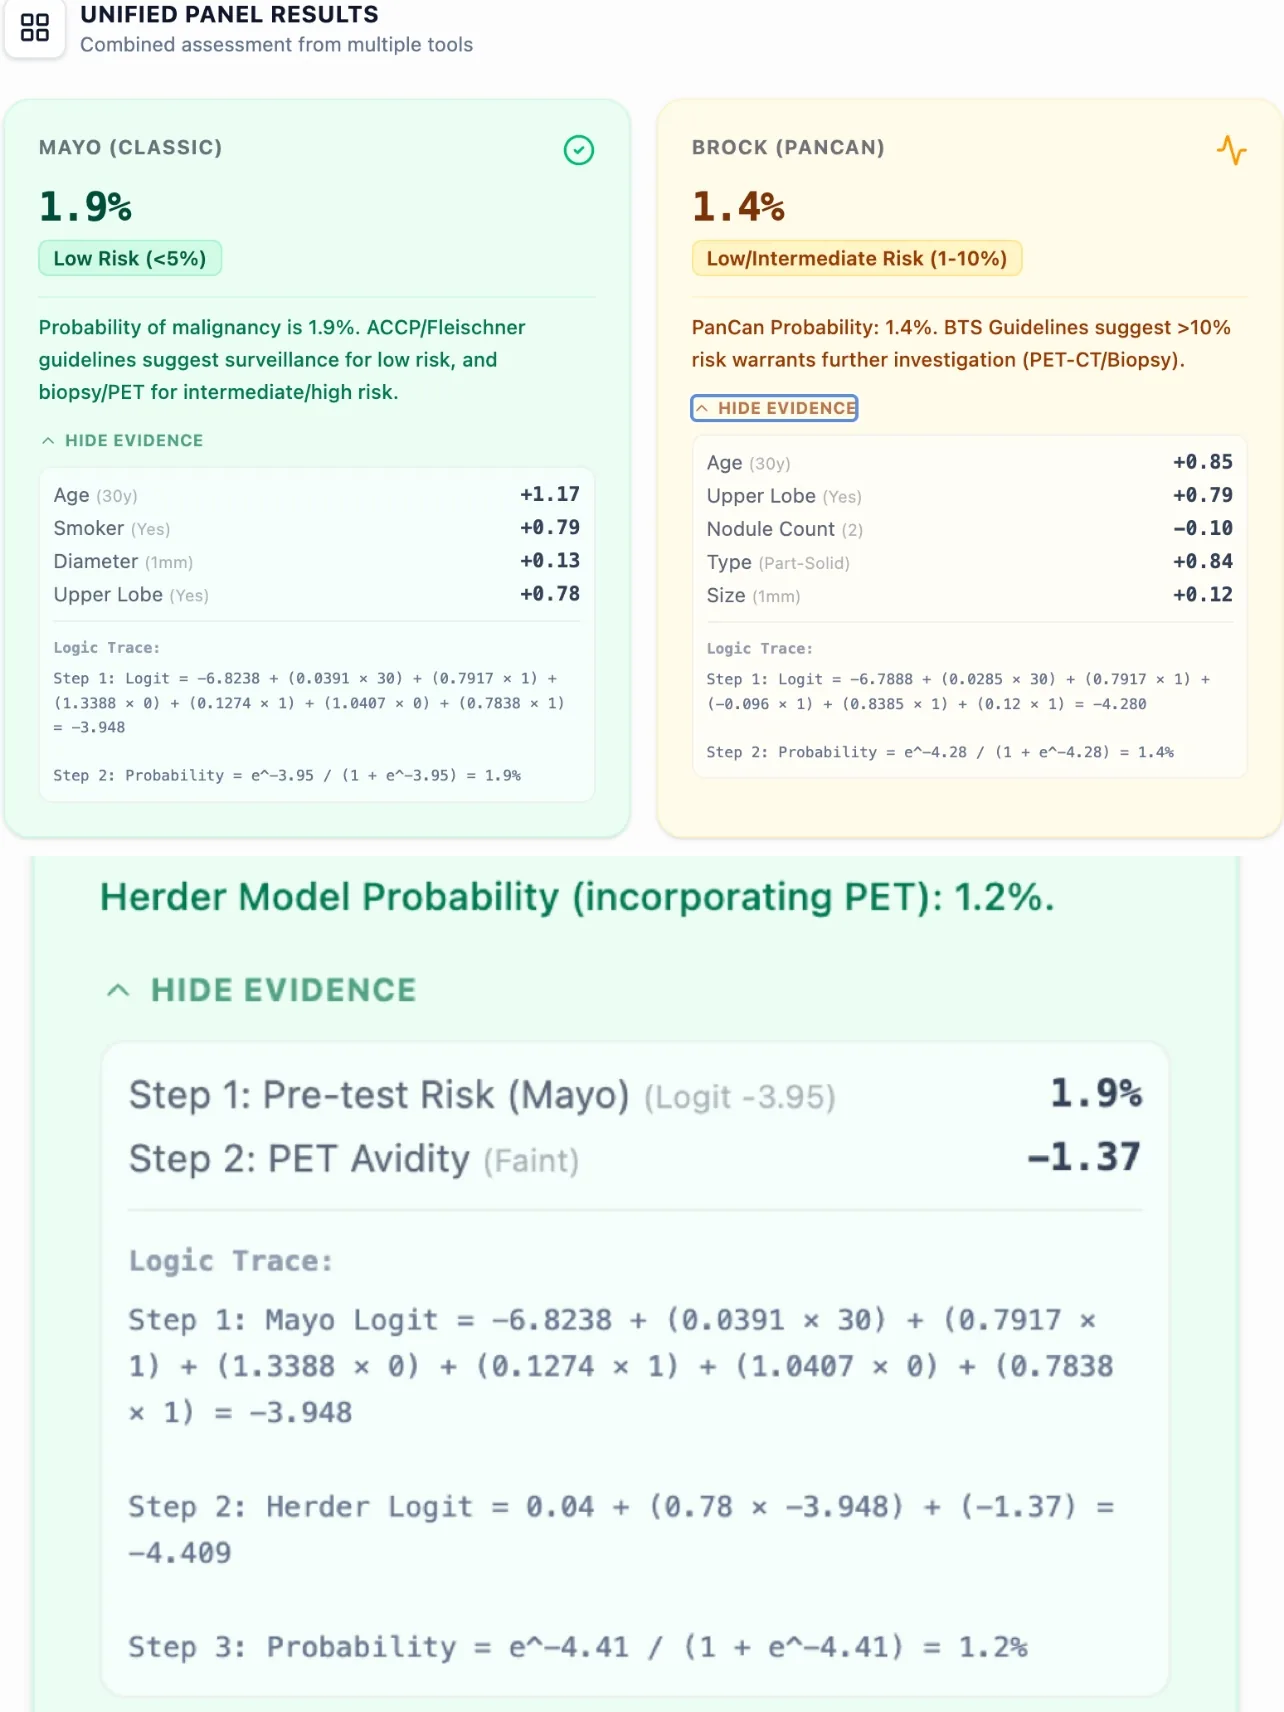
Figure 4. Side-by-side risk estimates from all three models promote transparency and clinical reasoning.
- How Our Calculator Works: From Input to Clinical Interpretation
5.1 Data Input and Interface Design
The calculator begins by collecting essential patient demographics and nodule characteristics through an intuitive, mobile-responsive interface designed for rapid data entry. Required inputs include:
- Patient demographics: Age (years), sex, smoking history (current/former versus never)
- Medical history: Extrathoracic cancer diagnosis >5 years ago, family history of lung cancer, presence of emphysema on CT
- Nodule characteristics: Longest diameter (mm), location (upper lobe versus other), density type (solid, part-solid, pure ground-glass), presence of spiculation, total nodule count
- Metabolic imaging: Whether FDG-PET has been performed; if yes, visual avidity score
This comprehensive variable set enables the calculator to populate all three models. For patients who have not undergone PET-CT, the Herder model cannot be computed, and the interface clearly communicates this limitation while still providing Mayo and Brock estimates.
5.2 Parallel Risk Calculation and Unified Results Display
Upon submission, the calculator performs parallel logistic regression computations for each applicable model. Results appear within 1–2 seconds in a unified panel format that includes:
- Individual model probabilities: Numerical percentages with color-coded risk stratification (green for low, amber for intermediate, red for high)
- Risk category labels: Descriptive categories aligned with guideline terminology (e.g., "Low Risk <5%," "Intermediate Risk 10–70%")
- Guideline-concordant management recommendations: Brief text summarizing BTS/Fleischner-recommended next steps
- Logic transparency: Expandable sections showing the complete mathematical derivation
This design philosophy prioritizes clinical actionability over raw data presentation. A busy thoracic oncologist reviewing cases before an MDT can instantly identify which nodules require urgent intervention versus those suitable for surveillance.
5.3 Enhanced Features for Clinical and Educational Use
Beyond basic probability estimation, the calculator incorporates several features:
Evidence transparency: Each model result includes a "Show Evidence" toggle that reveals the variable values and coefficient weightings. This feature supports informed shared decision-making during patient consultations.
Comparison mode: For trainees and quality improvement initiatives, the interface allows side-by-side comparison of how different variable values affect probability estimates.
Export and documentation: Results can be downloaded as PDF reports suitable for inclusion in electronic health records or MDT presentation slides.
- How the Platform Supports Both Clinical Care and Research
6.1 Routine Clinical Decision Support: Point-of-Care Through Multidisciplinary Teams
Initial detection and triage: When a chest CT performed for acute dyspnea reveals an incidental pulmonary nodule, rapid risk calculation at the point of discovery ensures appropriate urgency in downstream management.
Pulmonology consultation: Respiratory specialists integrate calculator outputs with clinical history and patient preferences to develop individualized plans. The calculator's mobility-responsive design supports bedside or clinic room use.
Multidisciplinary team meetings: As the cornerstone of thoracic oncology care, MDT conferences require efficient synthesis of information across 20–40 cases per session. Pre-population of risk scores streamlines case presentation.[13], [12]
Interventional procedure planning: For nodules proceeding to biopsy or resection, risk probabilities inform the choice of diagnostic modality. High-probability nodules may warrant proceeding directly to lobectomy with intraoperative frozen section.
6.2 Education and Simulation for Trainees
Respiratory and thoracic oncology fellows, radiology residents, and advanced practice providers in training benefit from the calculator's educational affordances. The logic transparency features allow learners to observe how individual variables impact malignancy probability. Supervising clinicians can assign simulated cases to challenge trainees to predict probabilities, analyzing discrepancies between trainee estimates and model predictions.
6.3 Clinical Research and Quality Improvement Applications
Guideline adherence studies: Healthcare systems can audit whether management decisions align with model-predicted risk categories.
Outcomes analysis: Prospective cohorts stratified by initial calculator risk enable evaluation of actual malignancy rates across risk categories.
Comparative effectiveness research: The calculator provides a standardized baseline for evaluating incremental diagnostic value of novel diagnostic technologies like blood-based liquid biopsy assays.
- Clinical FAQ
Can the Lung Nodule Malignancy Risk Panel be used in patients with emphysema or interstitial lung disease?
Yes, the Brock model explicitly incorporates emphysema as a predictor variable, recognizing that chronic obstructive pulmonary disease patients face elevated lung cancer risk independent of nodule characteristics. Clinicians managing patients with underlying parenchymal lung disease should preferentially weight Brock estimates, which account for this comorbidity.
How does the Lung Nodule Malignancy Risk Panel differ from Lung-RADS?
Lung-RADS represents a categorical classification system developed specifically for LDCT lung cancer screening programs. In contrast, the Lung Nodule Malignancy Risk Panel generates continuous probability estimates (0–100%) by integrating patient-level variables (age, smoking) with nodule characteristics, enabling more individualized risk assessment.
What is the most common mistake when calculating lung nodule malignancy risk?
The most frequent error involves applying screening-derived models (like Brock) to diagnostic populations with higher pre-test malignancy probability, or conversely, using clinically-derived models (Mayo) in screening contexts. The second common pitfall is overreliance on a single model output without considering clinical gestalt or regional disease patterns.
Is this risk calculator validated for Western and Asian populations?
The constituent models were primarily derived and validated in North American and European cohorts. Validation studies in Asian populations demonstrate variable performance, with some reports suggesting overestimation of malignancy risk in never-smokers. Clinicians serving Asian patient populations should interpret outputs with awareness of these limitations.
When should FDG-PET be ordered for nodule evaluation?
The BTS 2015 guidelines recommend PET-CT for nodules with Brock model risk ≥10%. PET is most valuable for solid nodules between 8–30mm diameter; smaller lesions approach the spatial resolution limits of current PET scanners, while larger lesions often proceed directly to tissue diagnosis.
- Get Started: Streamline Your Nodule Management Workflow Today
Pulmonary nodule management demands the integration of clinical acumen, radiographic interpretation, and evidence-based risk stratification—all delivered efficiently in time-constrained healthcare environments. The Lung Nodule Malignancy Risk Panel at OncoToolkit addresses this challenge by consolidating three internationally validated prediction models into a single, mobile-optimized interface.
We invite respiratory and critical care specialists, thoracic surgeons, radiologists, thoracic oncologists, and general medicine physicians to explore the calculator through several example cases:
- A 65-year-old former smoker with a 12mm spiculated solid upper lobe nodule
- A 50-year-old never-smoking woman with an 8mm part-solid nodule in the right lower lobe
- A 72-year-old current smoker with multiple sub-centimeter ground-glass nodules
Bookmark the calculator at https://oncotoolkit.com/calculator/panel-lung-nodule for rapid access during clinic sessions, MDT meetings, and educational conferences. Consider incorporating risk probability estimates into your electronic health record templates to standardize documentation.
For healthcare systems and multidisciplinary teams seeking to optimize nodule management workflows, OncoToolkit offers additional resources including case-based educational modules, institutional audit tools, and integration pathways. By reducing the cognitive load and time burden of manual risk calculation, our platform enables clinicians to focus expertise where it matters most: nuanced clinical judgment, patient-centered communication, and collaborative decision-making.
Discover how streamlined risk stratification can enhance your practice's efficiency and diagnostic precision. Visit https://oncotoolkit.com/calculator/panel-lung-nodule today and experience the difference that intelligent clinical decision support makes in daily thoracic oncology care.
Ready to Simplify Your Lung Nodule Risk Assessments?
Access our clinical-grade panel calculator and evidence-based management tools.
Access the Calculator Now
Free to use. No registration required.
References
- MacMahon H, et al. Guidelines for Management of Incidental Pulmonary Nodules Detected on CT Images: From the Fleischner Society 2017. Source
- Swensen SJ, et al. The probability of malignancy in solitary pulmonary nodules. Source
- ILCN. Deeper Dive: A Plethora of Prediction Models. Source
- McWilliams A, et al. Probability of Cancer in Pulmonary Nodules Detected on First Screening CT. Source
- Herder GJ, et al. Clinical prediction model to characterize pulmonary nodules: validation and added value of 18F-fluorodeoxyglucose positron emission tomography. Source
- CancerCalc. Solitary Pulmonary Nodule (SPN) Risk Score. Source
- Radiology Assistant. BTS Guideline for Pulmonary Nodules. Source
- Callister ME, et al. British Thoracic Society guidelines for the investigation and management of pulmonary nodules. Source
- Decision fatigue in clinical practice. Source
- MDM efficiency in lung cancer care. Source
- Time burden of MDT preparation. Source
- Automation in clinical workflows. Source
- Impact of digital tools on MDT meetings. Source
- Fleischner 2017 Guideline mapping. Source
- Risk-stratified management of SPN. Source
- NLST Outcomes and staging. Source
- Complications of transthoracic biopsy. Source
- Al-Ameri M, et al. Validation of Mayo and Brock models. Source
- Cui X, et al. Performance of prediction models in a diagnostic cohort. Source
- PET SUV vs visual scoring. Source
- Accuracy of PET in inflammatory regions. Source
- Phua J, et al. Lung cancer in Asian never-smokers and prediction model challenges. Source
- LNMRP Calculator Clinical Background Image. Source
- LNMRP Calculated Result Example. Source
- LNMRP Submission Form. Source
- LNMRP Reference Table. Source
- Lung nodule prevalence study. Source